通勤模式

使用 Python 分析美国人口普查数据

Lee Hachadoorian

Asst. Professor of Instruction, Temple University

通勤表

通勤主题

  • 交通方式(私家车、公共交通等)
  • 通勤时长
  • 上下班时间

通勤地理

  • 居住地:人们睡觉的地方
  • 工作地:人们工作的地方;可用于计算县、街区等的就业人口
使用 Python 分析美国人口普查数据

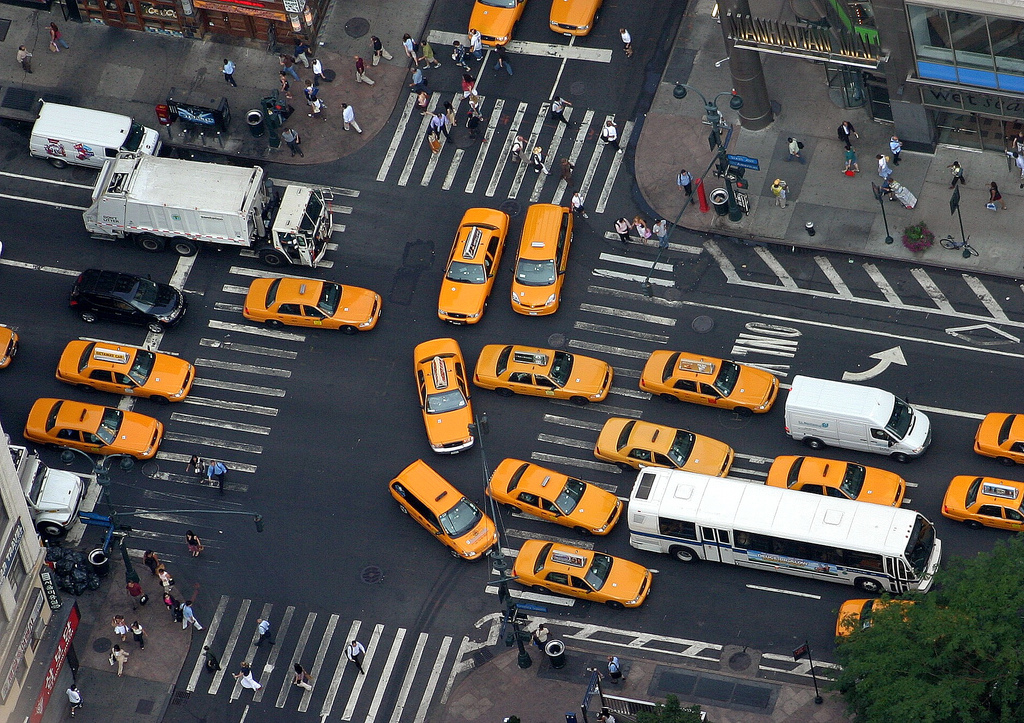
纽约市拥堵费

  • 正在纽约市讨论中(2019 年初)
  • 上次尝试失败(2007 年)
  • 担忧低/中等收入家庭的负担

纽约市街道上汽车与出租车的俯拍。

1 照片作者:Brian Jeffery Beggerly(CC BY 2.0)
使用 Python 分析美国人口普查数据

表 B08519:按过去 12 个月工人收入(2017 年通胀调整美元)与工作地理分布的上班交通方式

Total
    $1 to $9,999 or loss
    $10,000 to $14,999
    $15,000 to $24,999
    $25,000 to $34,999
    $35,000 to $49,999
    $50,000 to $64,999
    $65,000 to $74,999
    $75,000 or more
Car truck or van - drove alone
    <repeat income categories>
Car truck or van - carpooled
    <repeat income categories>
Public transportation (excluding taxicab)
    <repeat income categories>
etc...
使用 Python 分析美国人口普查数据

API 响应

print(r.json())
[['B08519_011E', 'B08519_012E', 'B08519_013E', 'B08519_014E', 'B08519_015E',
  'B08519_016E', 'B08519_017E', 'B08519_018E', 'B08519_020E', 'B08519_021E', 
  ... 
  'B08519_061E', 'B08519_062E', 'B08519_063E', 'state', 'county'], 
 ['10927', '9172', '19659', '22110', '32287', 
  '32977', '15693', '106972', '3663', '2518', 
  ...
  '7457', '2664', '20684', '36', '061']]
使用 Python 分析美国人口普查数据

重塑数据

# Read data row into list
data_row = r.json()[1][:-2]

# Break data row into list of lists iter_len = 8 data = [data_row[i:i+iter_len] for i in range(0, len(data_row), iter_len)]
print(data)
[['10927', '9172', '19659', '22110', '32287', '32977', '15693', '106972'], 
['3663', '2518', '5484', '5625', '8028', '7990', '3369', '22958'], 
['139358', '97178', '200514', '184510', '255491', '240973', '116673', '700808'], 
['16743', '9117', '15900', '13710', '17442', '20206', '10370', '85879'], ...]
使用 Python 分析美国人口普查数据

构建 DataFrame

# Define row names and column names
modes = ["drove_alone", "carpooled", "public", "walked", "taxi", 
         "worked_at_home"]

incomes = ["0k", "10k", "15k", "25k", "35k", "50k", "65k", "75k"]
# Create DataFrame manhattan = pd.DataFrame(data=data, index=modes, columns=incomes) manhattan = manhattan.astype(int)
使用 Python 分析美国人口普查数据

构建 DataFrame

print(manhattan)
                    0k    10k     15k   ...       50k     65k     75k
drove_alone      10716   8965   19294   ...     31502   15519  104078
carpooled         3740   2451    5852   ...      7994    3438   22625
public          140957  99474  197241   ...    235158  111959  654800
walked           16795   9045   15451   ...     20704   10663   83681
taxi              3201   2209    4515   ...      6551    3029   35572
worked_at_home    6854   3885    5489   ...      7776    2809   19598

[6 rows x 8 columns]
使用 Python 分析美国人口普查数据

构建热力图

# Create heatmap of commuters by mode by income
sns.heatmap(manhattan, annot=manhattan // 1000, fmt="d", cmap="YlGnBu")
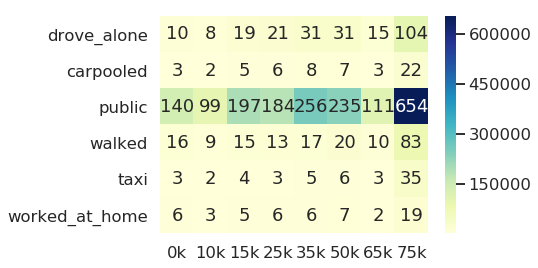
一张热力图:行是通勤方式,列是收入组;颜色表示人数。公共交通一行更深,收入≥$75,000 的公共交通单元格最深。

使用 Python 分析美国人口普查数据

Vamos praticar!

使用 Python 分析美国人口普查数据

Preparing Video For Download...