使用 Python 分析美国人口普查数据
Lee Hachadoorian
Asst. Professor of Instruction, Temple University
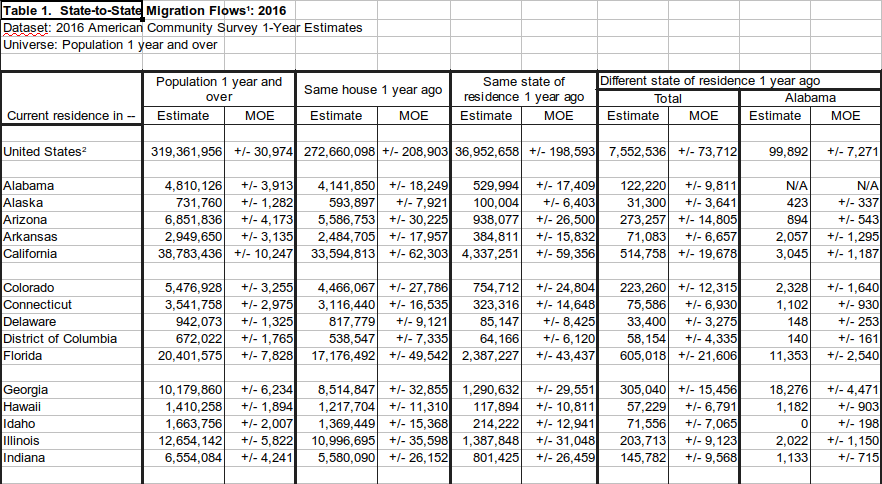
表名为"B07xxx",通常包含如下列:
print(to_cali_2016)
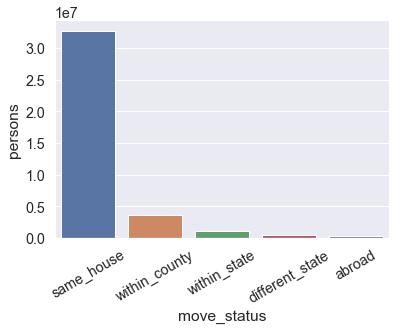
move_status persons
0 same_house 32740745
1 within_county 3581323
2 within_state 1062756
3 different_state 501384
4 abroad 305148
sns.barplot(x = "move_status",
y = "persons",
data = to_cali_2016)
数据来源:ACS 2016 表 B07001:按年龄统计的"过去一年地理流动性",以美国现居地为准


print(state_to_state.head())
Alabama Alaska Arizona ... Wisconsin Wyoming Puerto Rico
Alabama NaN 576.0 1022.0 ... 874.0 539.0 335.0
Alaska 423.0 NaN 1176.0 ... 260.0 291.0 848.0
Arizona 894.0 1946.0 NaN ... 6736.0 925.0 1462.0
Arkansas 2057.0 103.0 836.0 ... 539.0 178.0 857.0
California 3045.0 4206.0 33757.0 ... 7354.0 2674.0 1102.0
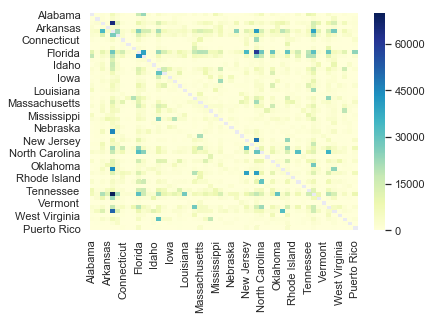
sns.heatmap(state_to_state, cmap="YlGnBu")
使用 Python 分析美国人口普查数据