提升原始数据的信息量

R 中的特征工程

Jorge Zazueta

Research Professor and Head of the Modeling Group at the School of Economics, UASLP

处理原始数据

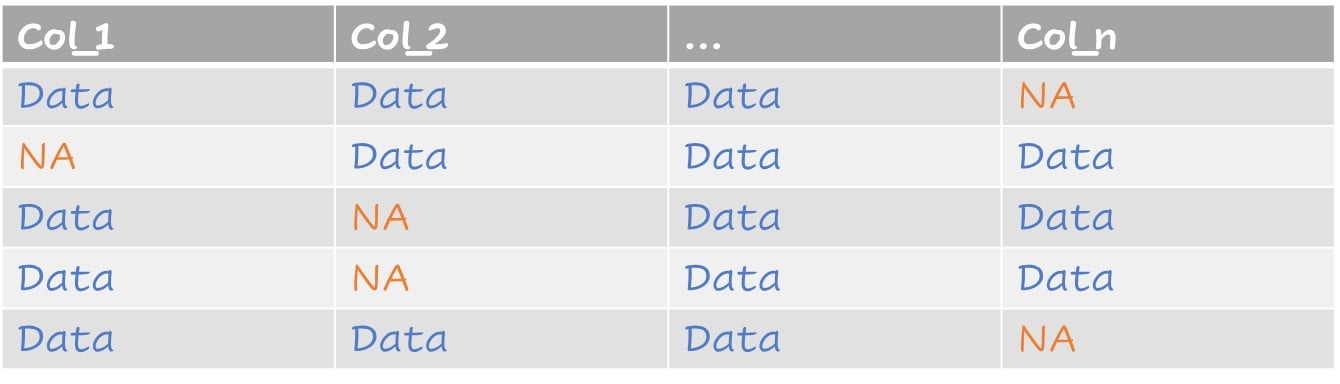
含缺失值的典型数据集

展示缺失数据示例的表格

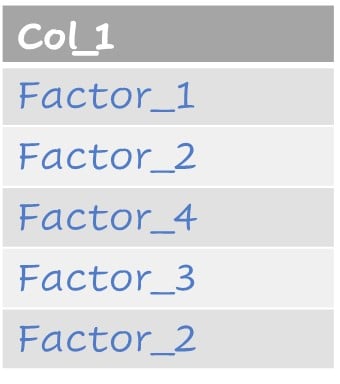
将取值视为因子

展示因子类型数据示例的表格

R 中的特征工程

处理原始数据

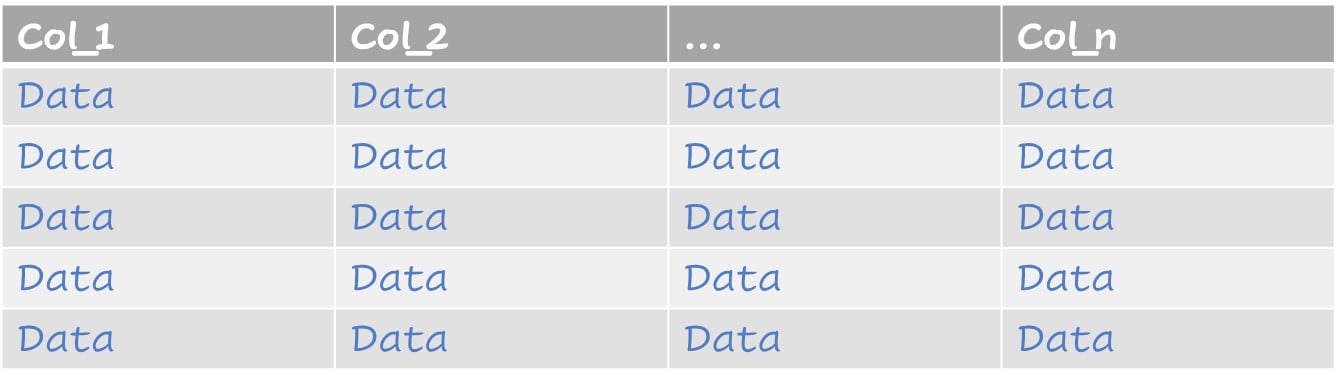
已插补的数据集

插补后无缺失的数据表

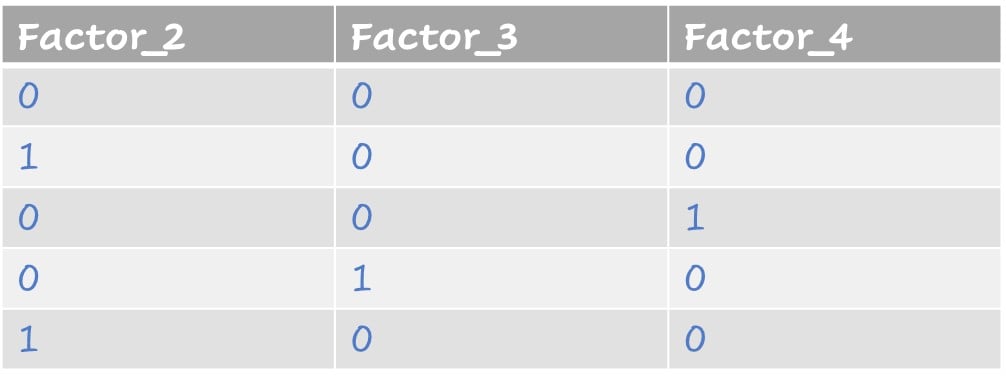
因子表示为虚拟变量

因子用虚拟变量表示

R 中的特征工程

贷款数据集

# A tibble: 614 × 13
   Loan_ID  Gender Married Dependents Educa…¹ Self_…² Appli…³ Coapp…⁴ LoanA…⁵ Loan_…⁶
   <fct>    <fct>  <fct>   <fct>      <fct>   <fct>     <dbl>   <dbl>   <dbl>   <dbl>
 1 LP001002 Male   No      0          Gradua… No         5849       0      NA     360
 2 LP001003 Male   Yes     1          Gradua… No         4583    1508     128     360
 3 LP001005 Male   Yes     0          Gradua… Yes        3000       0      66     360
 4 LP001006 Male   Yes     0          Not Gr… No         2583    2358     120     360
 5 LP001008 Male   No      0          Gradua… No         6000       0     141     360
 6 LP001011 Male   Yes     2          Gradua… Yes        5417    4196     267     360
 7 LP001013 Male   Yes     0          Not Gr… No         2333    1516      95     360
 8 LP001014 Male   Yes     3+         Gradua… No         3036    2504     158     360
 9 LP001018 Male   Yes     2          Gradua… No         4006    1526     168     360
10 LP001020 Male   Yes     1          Gradua… No        12841   10968     349     360
# … with 604 more rows, 3 more variables: Credit_History <dbl>, Property_Area <fct>,
#   Loan_Status <fct>, and abbreviated variable names ¹​Education, ²​Self_Employed,
#   ³​ApplicantIncome, ⁴​CoapplicantIncome, ⁵​LoanAmount, ⁶​Loan_Amount_Term
# ℹ Use `print(n = ...)` to see more rows, and `colnames()` to see all variable names
R 中的特征工程

缺失值

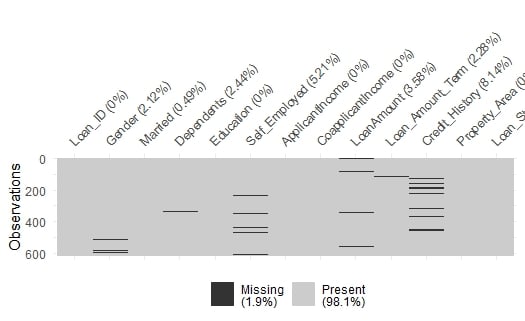
我们可用 naniar 包的 vis_miss(loans)loans 中直观看到缺失值。

显示整个数据集缺失值的图。

R 中的特征工程

缺失值

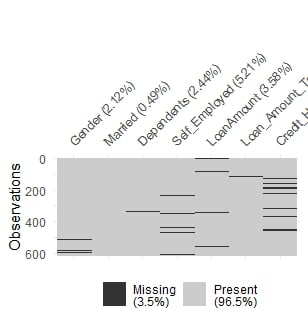
我们可筛选仅含缺失值的列来放大查看该表。

loans %>% 
select(Gender, 
       Married, 
       Dependents,
       Self_Employed,
       LoanAmount,
       Loan_Amount_Term, 
       Credit_History) %>%
  vis_miss()

缺失值的细致视图

所选特征的缺失值图。

R 中的特征工程

缺失值与虚拟变量

我们可以在同一个 recipe 中同时处理缺失值并创建虚拟变量。

lr_recipe <- 
  recipe(Loan_Status ~., 
         data = train) %>%
  update_role(Loan_ID, 
              new_role = "ID" ) %>%
  step_impute_knn(all_predictors()) %>%
  step_dummy(all_nominal_predictors())

打印该 recipe

lr_recipe
Recipe

Inputs:

      role #variables
        ID          1
   outcome          1
 predictor         30

Operations:

K-nearest neighbor imputation for all_predictors()
Dummy variables from all_nominal_predictors()
R 中的特征工程

查找合适的 recipe 步骤

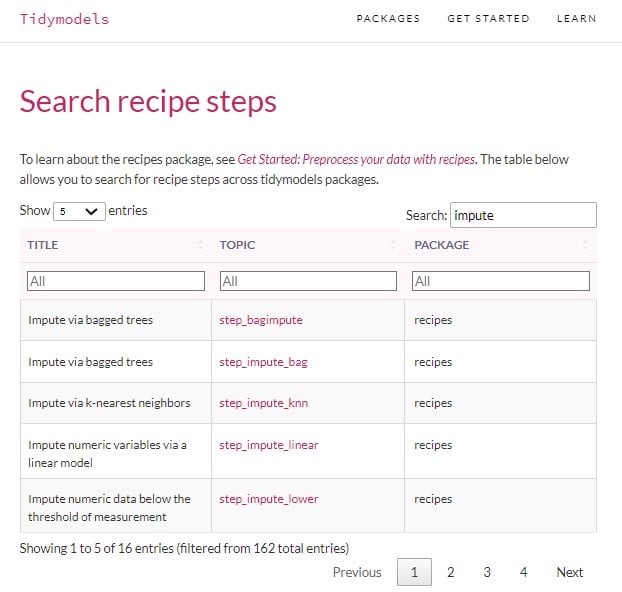
可在 tidymodels 文档查看其他插补方法及全部 recipe 步骤:www.tidymodels.org/find/recipes

tidymodels 文档中的 recipe 搜索工具。

R 中的特征工程

模型拟合与评估

# 拟合
lr_fit <- 
  lr_workflow %>% fit(data = train)
lr_aug <- 
  lr_fit %>% augment(test)
# 评估
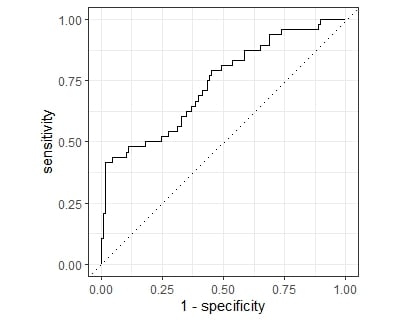
lr_aug %>%
  roc_curve(truth = Loan_Status, .pred_N) %>%
  autoplot()

bind_rows(lr_aug %>%
            roc_auc(truth = Loan_Status,
                    .pred_N),
          lr_aug %>%
            accuracy(truth = Loan_Status,
                     .pred_class))
# A tibble: 2 × 3
  .metric  .estimator .estimate
  <chr>    <chr>          <dbl>
1 roc_auc  binary         0.738
2 accuracy binary         0.792

R 中的特征工程

Passons à la pratique !

R 中的特征工程

Preparing Video For Download...