GARCH 预测与观测收益吻合吗?

在 R 中构建 GARCH 模型

Kris Boudt

Professor of finance and econometrics

评估指标

  • 取决于你想评估什么:
    • 预测的均值
    • 预测的方差
    • 预测的收益分布
在 R 中构建 GARCH 模型

1) 均值预测的拟合优度

基于已估计的 GARCH 模型,我们有:

实现

e <- residuals(tgarchfit) 
mean(e ^ 2)
在 R 中构建 GARCH 模型

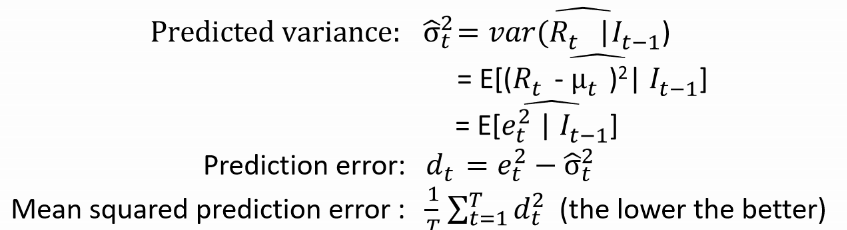
2) 方差预测的拟合优度

GARCH 模型得到:

实现

e <- residuals(tgarchfit)
d <- e ^ 2 - sigma(tgarchfit) ^ 2 
mean(d ^ 2)
在 R 中构建 GARCH 模型

EUR/USD 收益示例

tgarchspec <- ugarchspec(mean.model = list(armaOrder = c(0, 0)),
   variance.model = list(model = "sGARCH", variance.targeting = TRUE),
   distribution.model = "std")
tgarchfit <- ugarchfit(data = EURUSDret, spec = tgarchspec)
# 计算均值的均方预测误差
e <- residuals(tgarchfit) ^ 2
mean(e ^ 2) # 3.836205e-05
# 计算方差的均方预测误差
d <- e ^ 2 - sigma(tgarchfit) ^ 2
mean(d ^ 2) # 5.662366e-09
在 R 中构建 GARCH 模型

3) 分布拟合优度

  • GARCH 模型为样本中每个收益提供预测密度
    • 密度越高,该收益在所估计 GARCH 模型下越可能
    • 样本的似然等于所有这些密度的乘积。它衡量观测收益来自所估计 GARCH 模型的可能性
    • 似然越高,模型与数据越吻合
在 R 中构建 GARCH 模型

EUR/USD 收益示例

likelihood(tgarchfit) # returns 18528.58

与其他模型比较分析:

# 复杂模型,参数更多
flexgarchspec <- ugarchspec(mean.model = list(armaOrder = c(1, 0)),
                            variance.model = list(model = "gjrGARCH"),
                            distribution.model = "sstd")
flexgarchfit <- ugarchfit(data = EURUSDret, spec = flexgarchspec)
likelihood(flexgarchfit) # returns 18530.49
在 R 中构建 GARCH 模型

过拟合风险

注意:我们使用样本内评估,估计样本与评估样本相同。

过拟合风险:

过拟合是指选择过于复杂的模型,它在用于估计的样本上拟合良好,但对样本外的未来收益表现不佳。

在 R 中构建 GARCH 模型

方案:在拟合优度与复杂度惩罚间权衡

  • GARCH 模型被称为"简约"当:
    • 似然高
    • 参数数相对少
在 R 中构建 GARCH 模型

信息准则

  • 用信息准则衡量简约性。

信息准则 = - 似然 + 惩罚(参数个数)

  • 越低越好。

经验法则:
选择信息准则最低的模型。

在 R 中构建 GARCH 模型

信息准则结果

方法 infocriteria() 输出不同惩罚下的信息准则。

infocriteria(tgarchfit)

out Akaike -7.468081 Bayes -7.462833 Shibata -7.468083 Hannan-Quinn -7.466241 `

解读需与其他模型的信息准则比较。

在 R 中构建 GARCH 模型

EUR/USD 收益中的示例

tgarchspec <- ugarchspec(mean.model = list(armaOrder = c(0, 0)),
   variance.model = list(model = "sGARCH", variance.targeting = TRUE),
   distribution.model = "std")
tgarchfit <- ugarchfit(data = EURUSDret, spec = tgarchspec)
length(coef(tgarchfit)) # only 5 parameters
likelihood(tgarchfit)   # equals 18528.58
flexgarchspec <- ugarchspec(mean.model = list(armaOrder = c(1, 0)),
   variance.model = list(model = "gjrGARCH"), distribution.model = "sstd")
flexgarchfit <- ugarchfit(data = EURUSDret, spec = flexgarchspec)
length(coef(flexgarchfit)) # we now have 8 parameters
likelihood(flexgarchfit) #  18530.49: likelihood increased
在 R 中构建 GARCH 模型

对 EUR/USD 收益,哪个模型更简约?

似然越高越好。信息准则越低越好。

infocriteria(tgarchfit) # 简单模型
Akaike       -7.468435
Bayes        -7.464499
infocriteria(flexgarchfit) # 复杂模型
Akaike       -7.467239
Bayes        -7.456742

此处信息准则最低的是简单模型,应优先选用。

在 R 中构建 GARCH 模型

结果因案例而异:MSFT 收益

tgarchfit <- ugarchfit(data = msftret, spec = tgarchspec)
flexgarchfit <- ugarchfit(data = msftret, spec = flexgarchspec)
infocriteria(tgarchfit)
Akaike       -5.481895
Bayes        -5.477833
infocriteria(flexgarchfit) 
Akaike       -5.489087
Bayes        -5.478255

此处信息准则最低的是复杂模型,应优先选用。

在 R 中构建 GARCH 模型

KISS:保持"巧而简"

在 R 中构建 GARCH 模型

Preparing Video For Download...