在生产中使用已验证的 GARCH 模型

在 R 中构建 GARCH 模型

Kris Boudt

Professor of finance and econometrics

用于生产
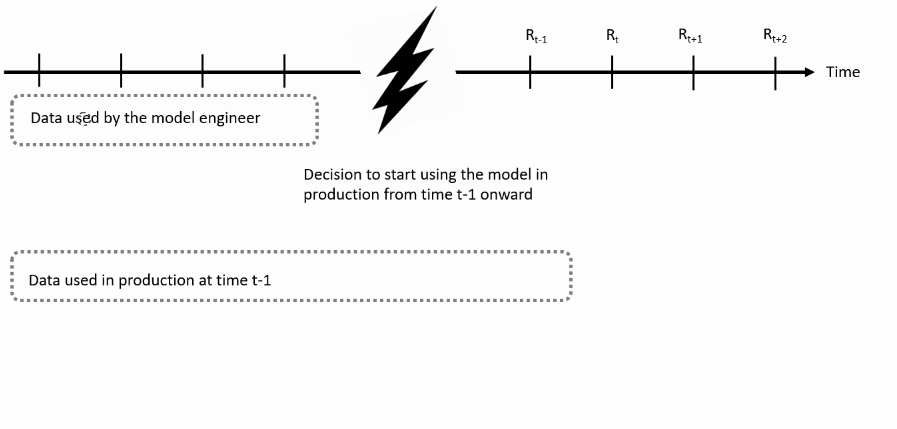
各年每日收益分布

在 R 中构建 GARCH 模型

新功能

  • ugarchfilter() 分析近期的均值与波动率动态
  • ugarchforecast() 作用于 ugarchspec 对象(而非 ugarchfit())来预测未来的均值与波动率
在 R 中构建 GARCH 模型

MSFT 收益示例

  • msftret:1999–2017 年的日收益。
  • 假设模型拟合使用了截至 2010 年底的收益。
  • 在 2017 年底使用该模型分析过去的波动率动态并预测未来波动率。
在 R 中构建 GARCH 模型

步骤 1:定义最终模型规范

使用 2010 年底前可用的 msftret 拟合最佳模型:

# 指定带偏度 t 分布的 AR(1)-GJR GARCH 模型
garchspec <- ugarchspec(mean.model = list(armaOrder = c(1,0)),
 variance.model = list(model = "gjrGARCH"), distribution.model = "sstd")
# 估计模型
garchfit <- ugarchfit(data = msftret["/2010-12"], spec = garchspec)

progarchspec 定义为生产用规范,并执行 setfixed(progarchspec) <- as.list(coef(garchfit))

progarchspec <- garchspec
setfixed(progarchspec) <- as.list(coef(garchfit))
在 R 中构建 GARCH 模型

步骤 2:分析均值与波动率动态

使用 ugarchfilter()

garchfilter <- ugarchfilter(data = msftret, spec = progarchspec)
plot(sigma(garchfilter))                                
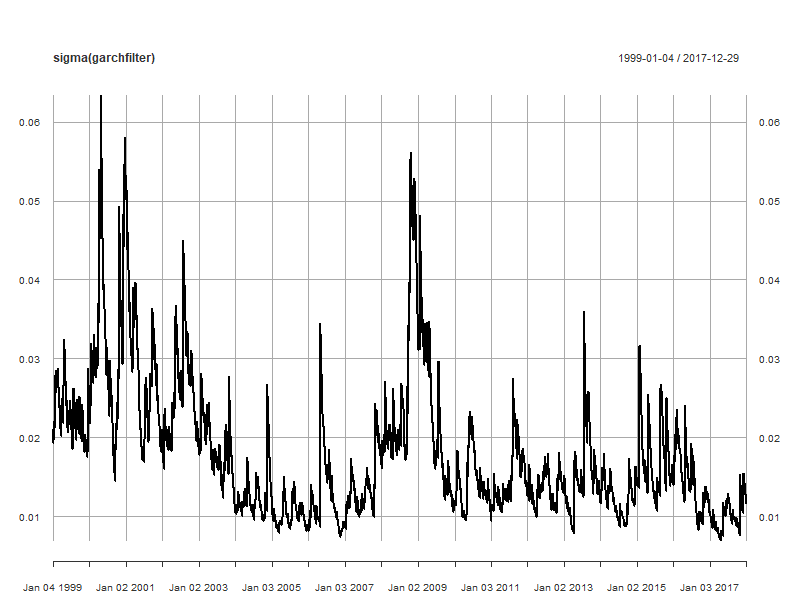
各年每日收益分布

在 R 中构建 GARCH 模型

步骤 3:预测未来收益

garchforecast <- ugarchforecast(data = msftret,
                                fitORspec = progarchspec, 
                                n.ahead = 10) # 预测接下来 10 天
cbind(fitted(garchforecast), sigma(garchforecast))
       2017-12-29 2017-12-29
T+1  0.0004781733 0.01124870
T+2  0.0003610470 0.01132550
T+3  0.0003663683 0.01140171
T+4  0.0003661265 0.01147733
T+5  0.0003661375 0.01155238
T+6  0.0003661370 0.01162688
T+7  0.0003661371 0.01170083
T+8  0.0003661371 0.01177424
T+9  0.0003661371 0.01184712
T+10 0.0003661371 0.01191948
在 R 中构建 GARCH 模型

用于模拟

与其用完整模型分析观测收益,不如用它来模拟人工对数收益:

$$ r_{t} = \log(P_{t}) - \log(P_{t-1}) $$

用于评估未来收益的随机性及其对价格的影响,因为未来价格为:

$$ P_{t + h} = P_{t} \exp(r_{t + 1} + r_{t + 2} + \ldots + r_{t + h}) $$

在 R 中构建 GARCH 模型

步骤 1:校准模拟模型

在估计中使用对数收益

# 计算对数收益
msftlogret <- diff(log(MSFTprice))[-1]

估计模型,并将其参数用于模拟模型

garchspec <- ugarchspec(mean.model = list(armaOrder = c(1, 0)),
                        variance.model = list(model = "gjrGARCH"),
                        distribution.model = "sstd")
# 估计模型
garchfit <- ugarchfit(data = msftlogret, spec = garchspec)

# 将估计模型设为模拟所用模型
simgarchspec <- garchspec
setfixed(simgarchspec) <- as.list(coef(garchfit))
在 R 中构建 GARCH 模型

步骤 2:用 `ugarchpath()` 运行模拟

使用 ugarchpath() 进行模拟需选择:

  • spec:完整指定的 GARCH 模型
  • m.sim:需要的模拟收益序列数量
  • n.sim:每个模拟序列的观测数(如 252)
  • rseed:用于固定随机种子的任意数(保证可复现)
simgarch <- ugarchpath(spec = simgarchspec, m.sim = 4,
                       n.sim = 10 * 252, rseed = 12345)
在 R 中构建 GARCH 模型

步骤 3:分析模拟收益

方法 fitted() 提供模拟收益:

simret <- fitted(simgarch)
plot.zoo(simret) 
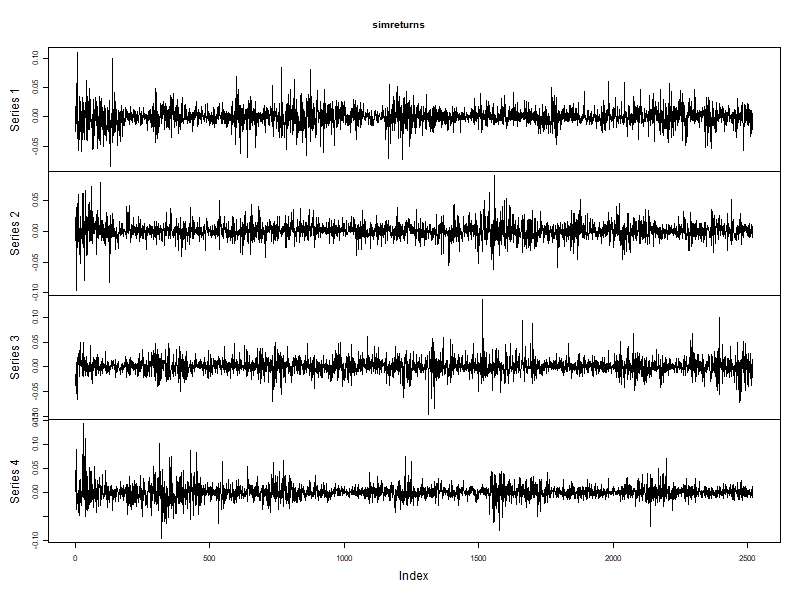
模拟的收益

在 R 中构建 GARCH 模型

分析模拟波动率

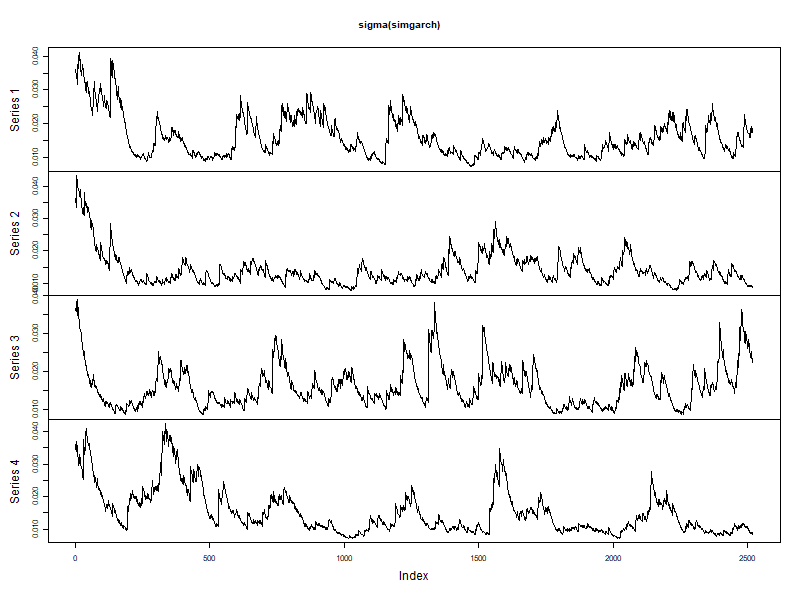
plot.zoo(sigma(simgarch))

模拟的波动率

在 R 中构建 GARCH 模型

分析模拟价格

绘制 4 条为期 10 年、初始价为 1 的股票价格模拟:

simprices <- exp(apply(simret, 2, "cumsum"))
matplot(simprices, type = "l", lwd = 3)
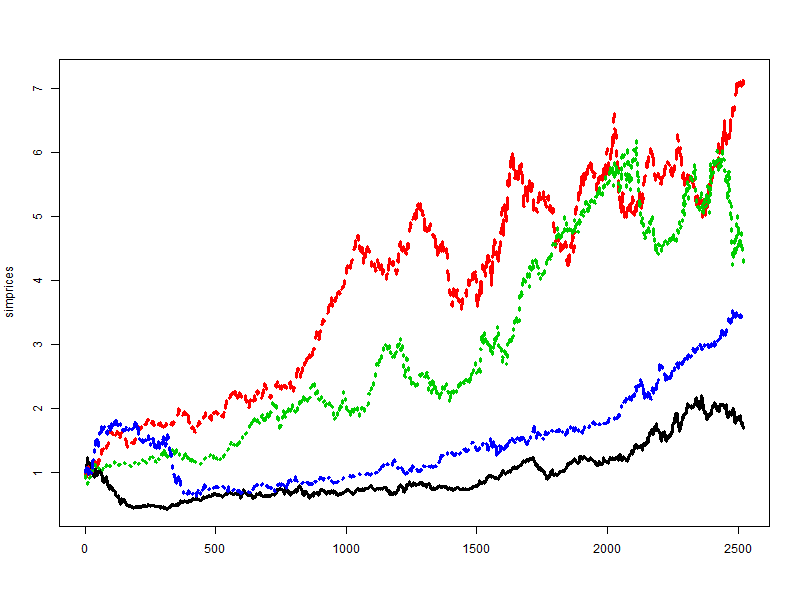
模拟的价格

在 R 中构建 GARCH 模型

练习 setfixed()、ugarchfilter()、ugarchforecast() 和 ugarchpath()

在 R 中构建 GARCH 模型

Preparing Video For Download...