可视化常见术语

用 R 分析社交媒体数据

Vivek Vijayaraghavan

Data Science Coach

课程概览

  • 从文本语料中提取最高频术语
  • 移除自定义停用词并精炼语料
  • 用柱状图与词云可视化热门术语
用 R 分析社交媒体数据

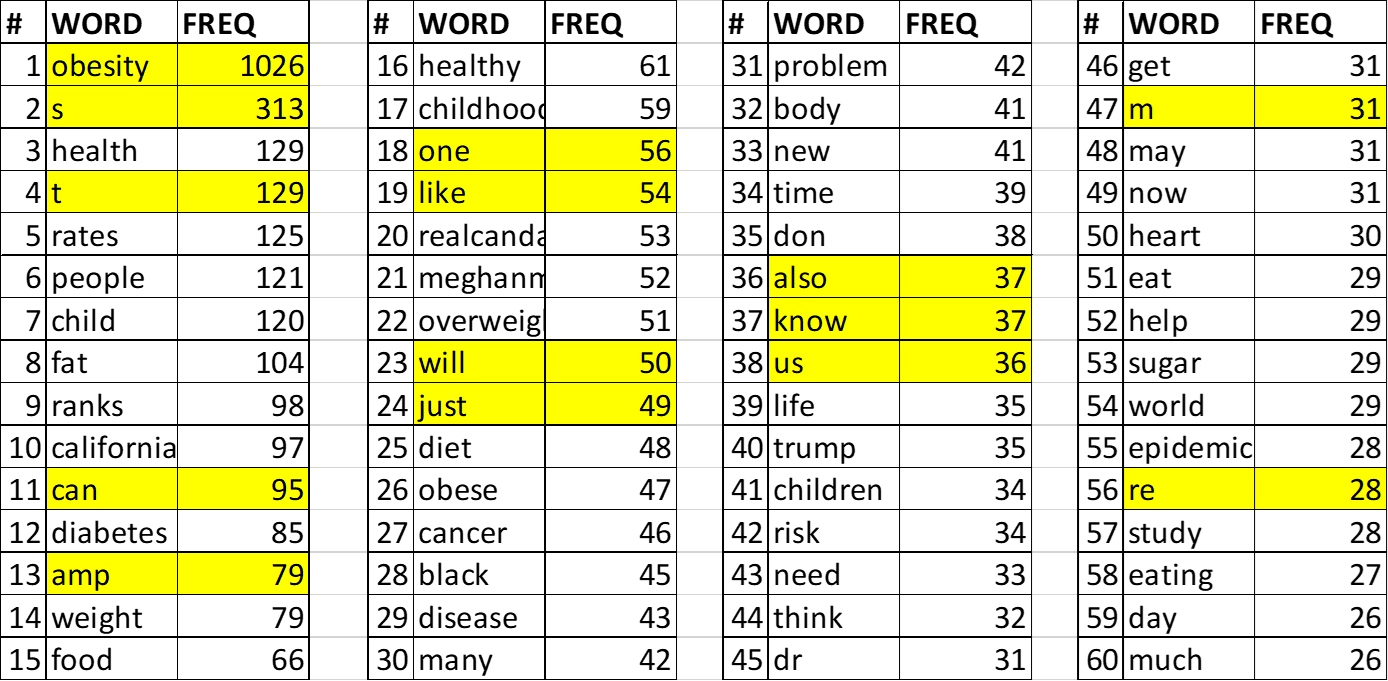
术语频率

  • 提取术语频率,即每个词的出现次数
# Extract term frequency
library(qdap)
term_count  <-  freq_terms(twt_corpus_final, 60)
term_count
用 R 分析社交媒体数据

术语频率

术语频率

用 R 分析社交媒体数据

移除自定义停用词

# Create a vector of custom stop words
custom_stop <- c("obesity", "can", "amp", "one", "like", "will", "just", 
                "many", "new", "know", "also", "need", "may", "now", 
                "get", "s", "t", "m", "re")
# Remove custom stop words
twt_corpus_refined <- tm_map(twt_corpus_final,removeWords, custom_stop)
用 R 分析社交媒体数据

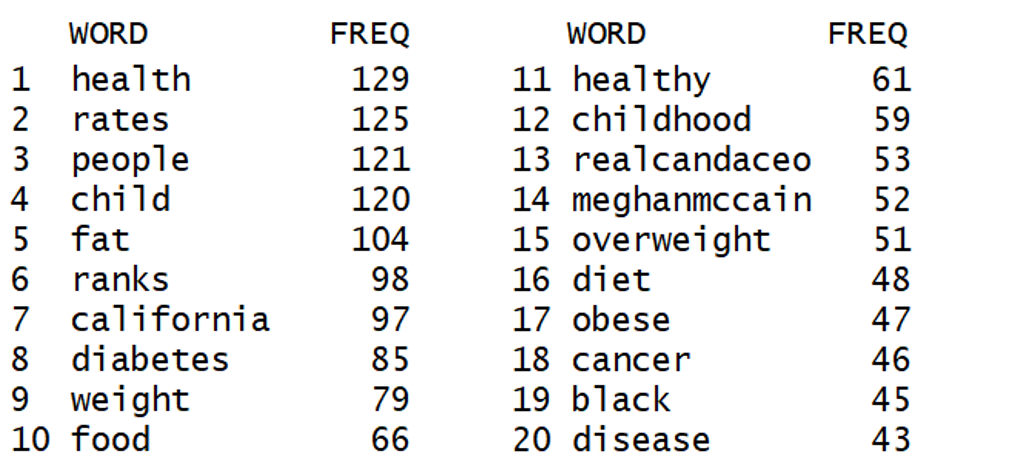
精炼语料后的术语计数

# Term count after refining corpus
term_count_clean <- freq_terms(twt_corpus_refined, 20)
term_count_clean
用 R 分析社交媒体数据

精炼语料后的术语频率

精炼语料后的术语频率

  • 推广肥胖管理项目的品牌可据此分析这些术语
用 R 分析社交媒体数据

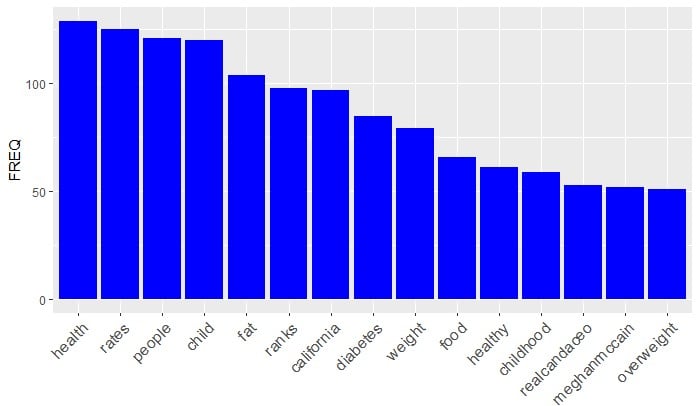
热门术语的柱状图

  • 绘制出现次数>50的术语柱状图
  • 柱状图以直观方式概括热门术语
# Create a subset dataframe
term50 <- subset(term_count_clean, FREQ > 50)
用 R 分析社交媒体数据

最高频术语的柱状图

library(ggplot2)
# Create a bar plot of frequent terms
ggplot(term50, aes(x = reorder(WORD,  -FREQ),  y = FREQ)) +
       geom_bar(stat = "identity", fill = "blue") + 
       theme(axis.text.x = element_text(angle = 45, hjust = 1))
用 R 分析社交媒体数据

热门术语的柱状图

热门术语的柱状图

用 R 分析社交媒体数据

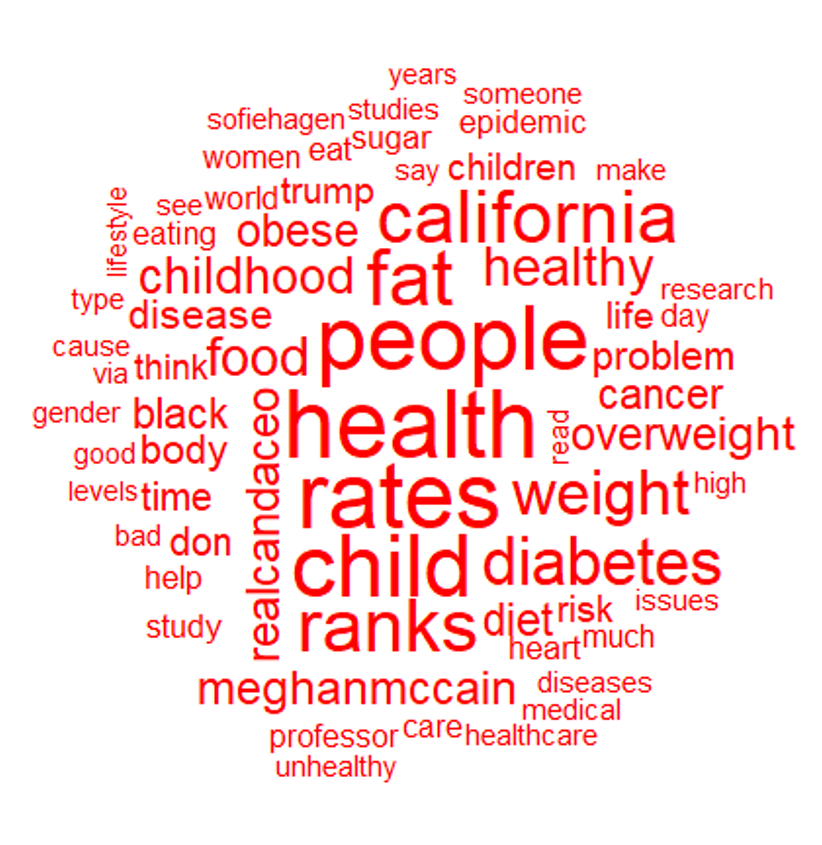
词云

  • 用词云可视化高频术语
  • 词云是由词组成的图像
  • 词越大表示频率越高
  • 适用于推广海报
  • 传达品牌信息并突出热门术语
用 R 分析社交媒体数据

按最小频率生成词云

  • wordcloud() 函数用于创建词云
# Create a word cloud based on min frequency
library(wordcloud)
wordcloud(twt_corpus_refined, min.freq = 20, colors = "red", 
          scale = c(3,0.5), random.order = FALSE)
用 R 分析社交媒体数据

按最小频率生成词云

按最小频率生成的词云

用 R 分析社交媒体数据

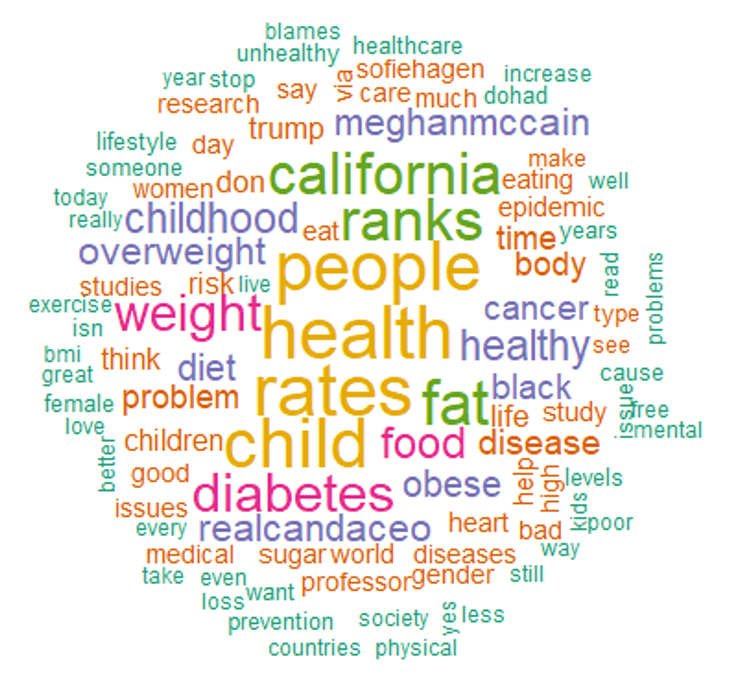
彩色词云

# Create a colorful word cloud
library(RColorBrewer)
wordcloud(twt_corpus_refined, max.words = 100, 
          colors = brewer.pal(6,"Dark2"), scale = c(2.5,.5),
          random.order = FALSE)
用 R 分析社交媒体数据

彩色词云

多色词云

用 R 分析社交媒体数据

Ayo berlatih!

用 R 分析社交媒体数据

Preparing Video For Download...