绘制单变量

R 中的 plotly 交互式数据可视化

Adam Loy

Statistician, Carleton College

探索葡萄酒数据

library(dplyr)
glimpse(wine)
Rows: 178
Columns: 14
$ Type            <fct> 1, 1, 1, 1, 1, 1, 1, 1, 1, 1, 1, 1, 1, 1, 1, 1...
$ Alcohol         <dbl> 14.23, 13.20, 13.16, 14.37, 13.24, 14.20, 14.3...
$ Malic           <dbl> 1.71, 1.78, 2.36, 1.95, 2.59, 1.76, 1.87, 2.15...
...
$ Hue             <dbl> 1.04, 1.05, 1.03, 0.86, 1.04, 1.05, 1.02, 1.06...
$ Dilution        <dbl> 3.92, 3.40, 3.17, 3.45, 2.93, 2.85, 3.58, 3.58...
$ Proline         <int> 1065, 1050, 1185, 1480, 735, 1450, 1290, 1295,...
R 中的 plotly 交互式数据可视化

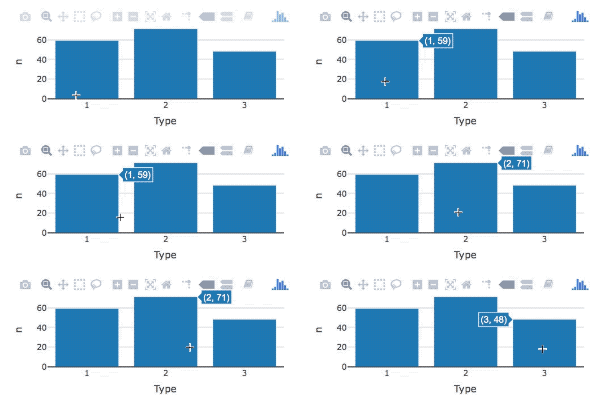
使用 plotly 绘制柱状图

柱状图动图

library(plotly)

wine %>%
   count(Type) %>%                 
   plot_ly(x = ~Type, y = ~n) %>% 
   add_bars()
  • 使用 count() 创建频数表
  • 用 ~ 指定映射
  • 用 add_bars() 添加柱形轨迹
R 中的 plotly 交互式数据可视化

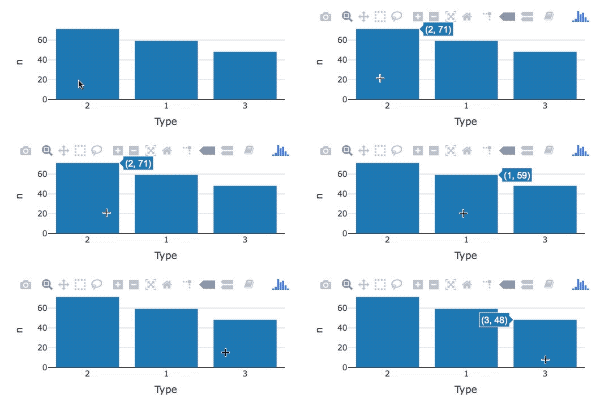
重排柱子

柱状图重排动图

library(forcats)
wine %>%
  count(Type) %>%                 
  mutate(Type = fct_reorder(Type, n, .desc = TRUE)) %>% 
  plot_ly(x = ~Type, y = ~n) %>%
  add_bars()
  • 用 fct_reorder() 重排柱子
  • 将 .desc 设为 TRUE
R 中的 plotly 交互式数据可视化

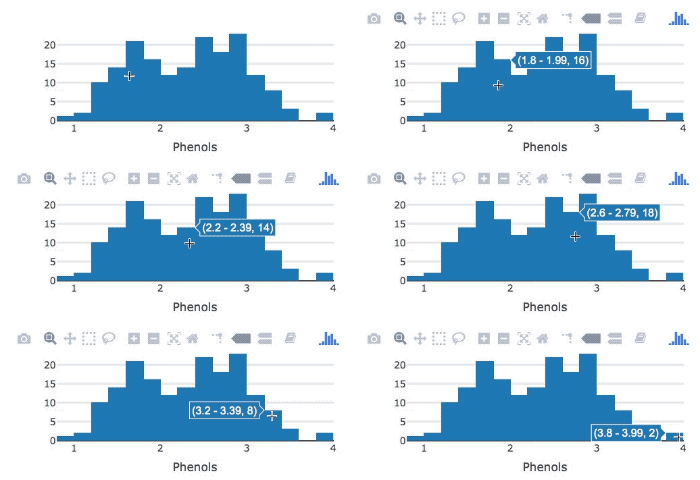
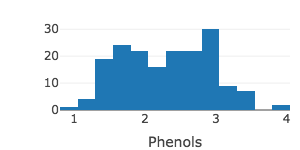
使用 plotly 绘制直方图

直方图动图

wine %>%
   plot_ly(x = ~Phenols) %>%  # specify aesthetics

add_histogram() # add the histogram trace
R 中的 plotly 交互式数据可视化

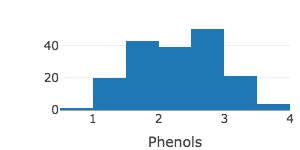
调整箱数

wine %>%
   plot_ly(x = ~Phenols) %>% 
   add_histogram(nbinsx = 10)
R 中的 plotly 交互式数据可视化

调整箱宽

wine %>%
   plot_ly(x = ~Phenols) %>% 
   add_histogram(xbins = list(start = 0.8, end = 4, size = 0.25))
R 中的 plotly 交互式数据可视化

Passons à la pratique !

R 中的 plotly 交互式数据可视化

Preparing Video For Download...