可视化度量

R 中的购物篮分析

Christopher Bruffaerts

Statistician

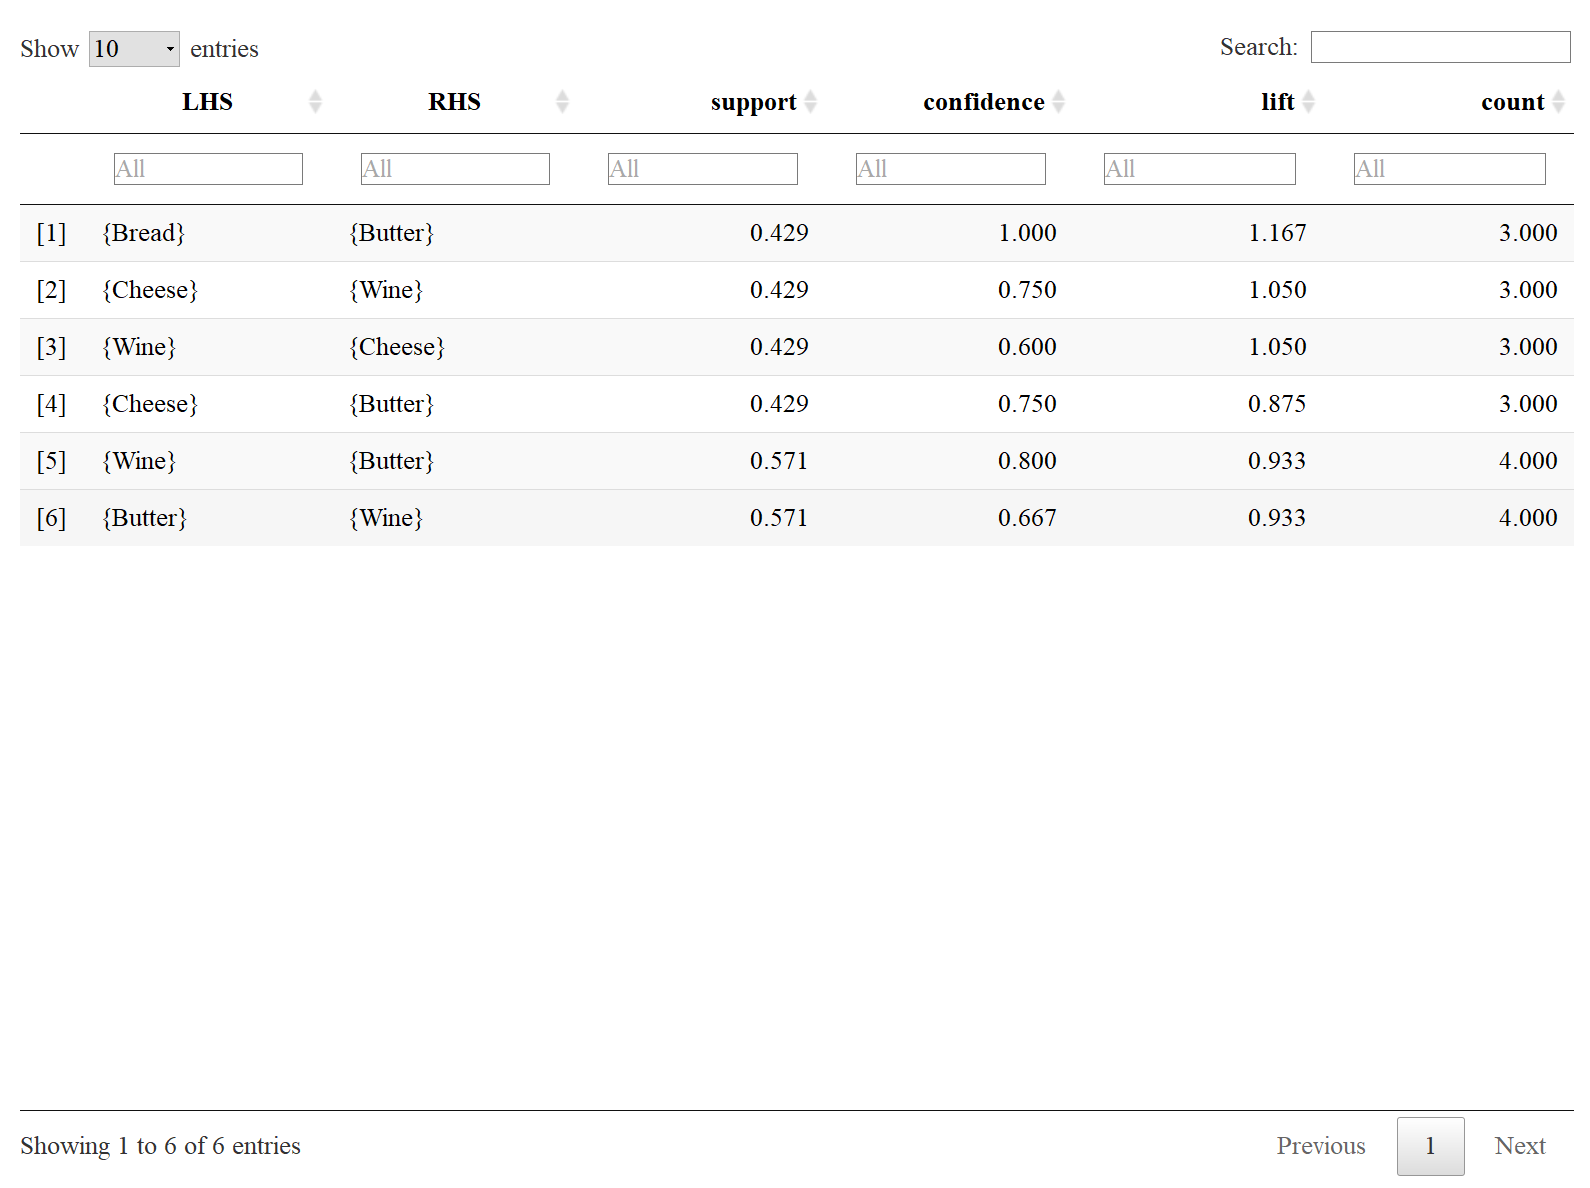
含度量的交互式表格

超市规则

library(arules)
rules = apriori(data_trx, 
                parameter = list(
                  supp = 3/7, conf=0.6, minlen=2)
                )
inspect(rules)

交互式表

library(arulesViz)
inspectDT(rules)

HTML 表

inspect_DT_rule

R 中的购物篮分析

散点图简介

查看规则

inspect(rules)
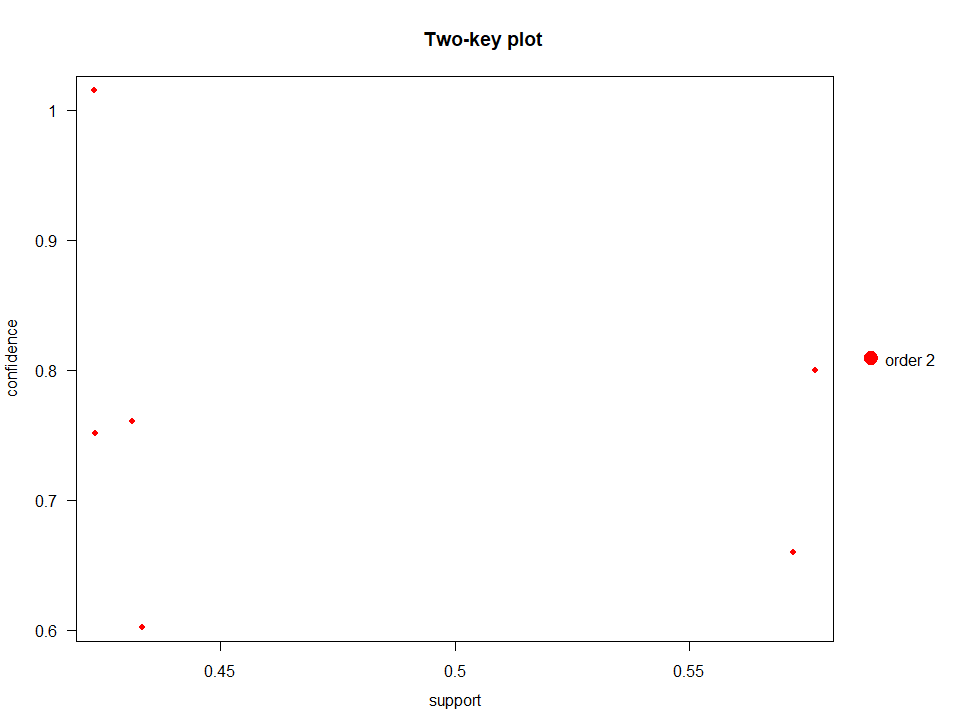
    lhs         rhs      support   confidence lift      count
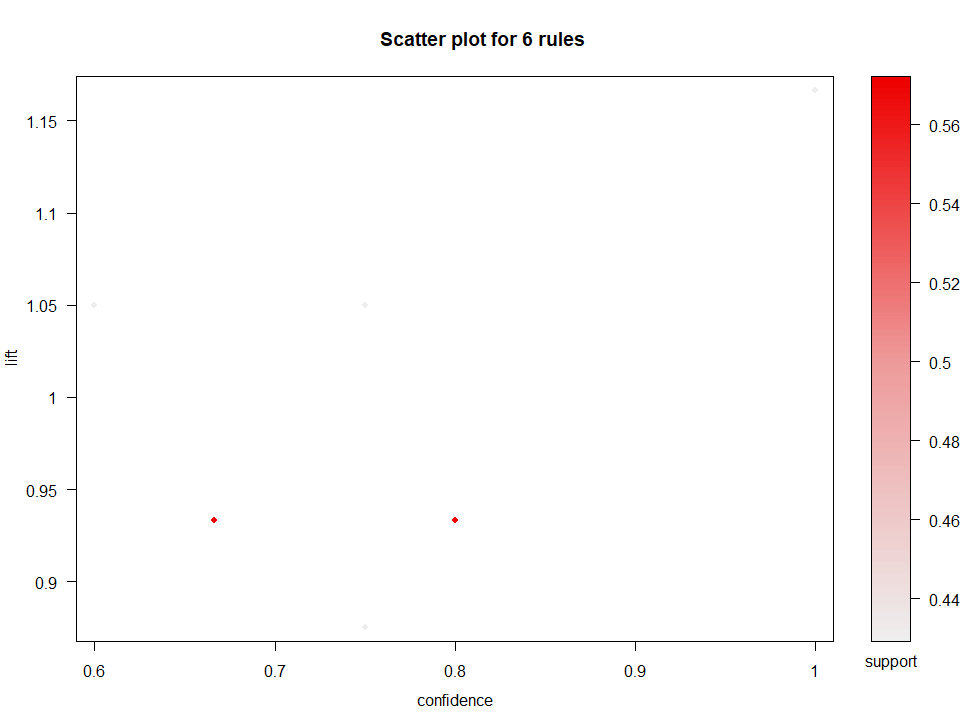
[1] {Bread}  => {Butter} 0.4285714 1.0000000  1.1666667 3    
[2] {Cheese} => {Wine}   0.4285714 0.7500000  1.0500000 3    
[3] {Wine}   => {Cheese} 0.4285714 0.6000000  1.0500000 3    
[4] {Cheese} => {Butter} 0.4285714 0.7500000  0.8750000 3    
[5] {Wine}   => {Butter} 0.5714286 0.8000000  0.9333333 4    
[6] {Butter} => {Wine}   0.5714286 0.6666667  0.9333333 4

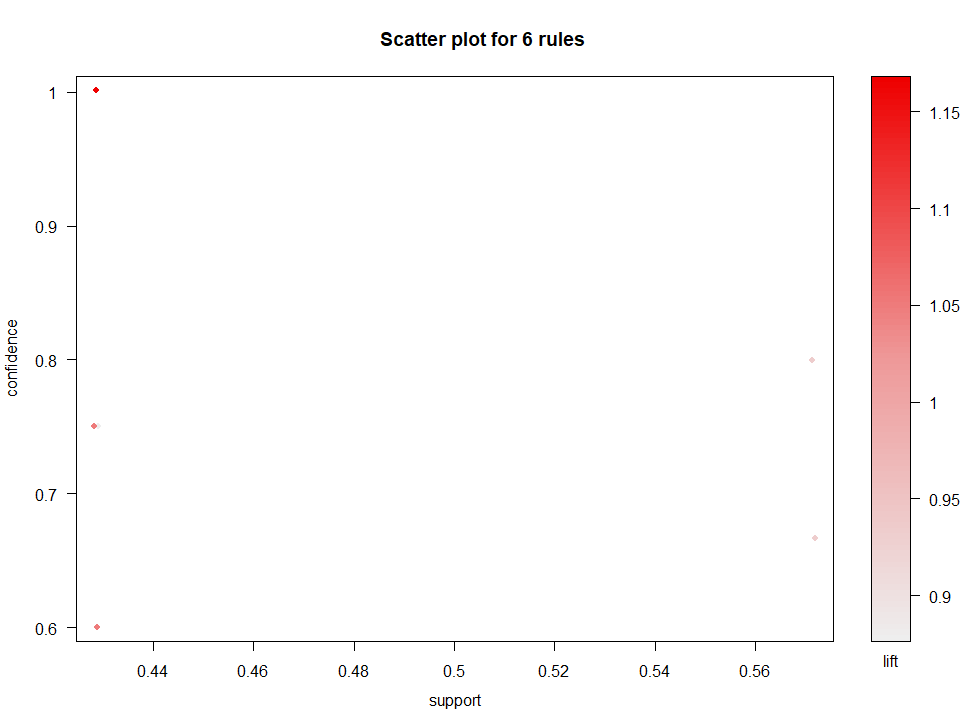
arulesViz 散点图

plot(rules)

scatter_grocery

R 中的购物篮分析

灵活的 arules 图

绘图选项

plot(rulesObject, measure, shading, method)
  • rulesObject:要绘制的规则对象
  • measure:规则有趣度度量(support、confidence、lift 等)
  • shading:用于着色的度量
  • method:可视化方法("scatterplot"、"matrix"、"two-key plot"、"matrix3D")

示例

plot(rules, measure = c("confidence", "lift"),
     shading = "support",
     method = "scatterplot")
scatter_grocery_plot

R 中的购物篮分析

其他 arules 图

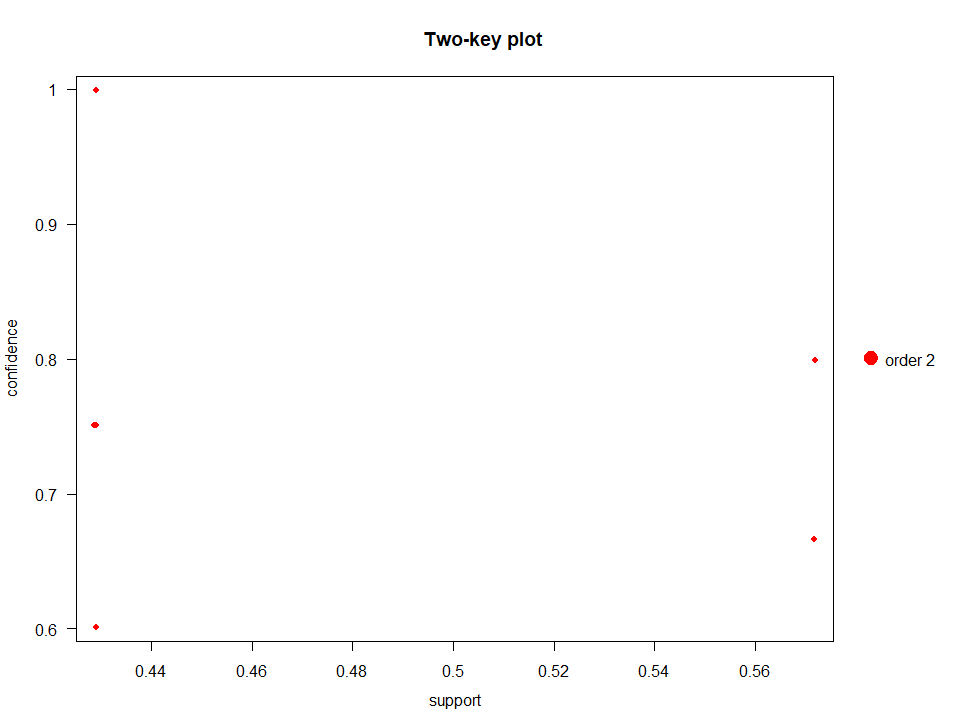
双键图(two-key plot)

plot(rules, method = "two-key plot")

two_key_plot

R 中的购物篮分析

为图添加抖动

无抖动

plot(rules, method = "two-key plot")

two_key_plot

添加抖动

plot(rules, method = "two-key plot",jitter = 2)
two_key_plot_jitter

R 中的购物篮分析

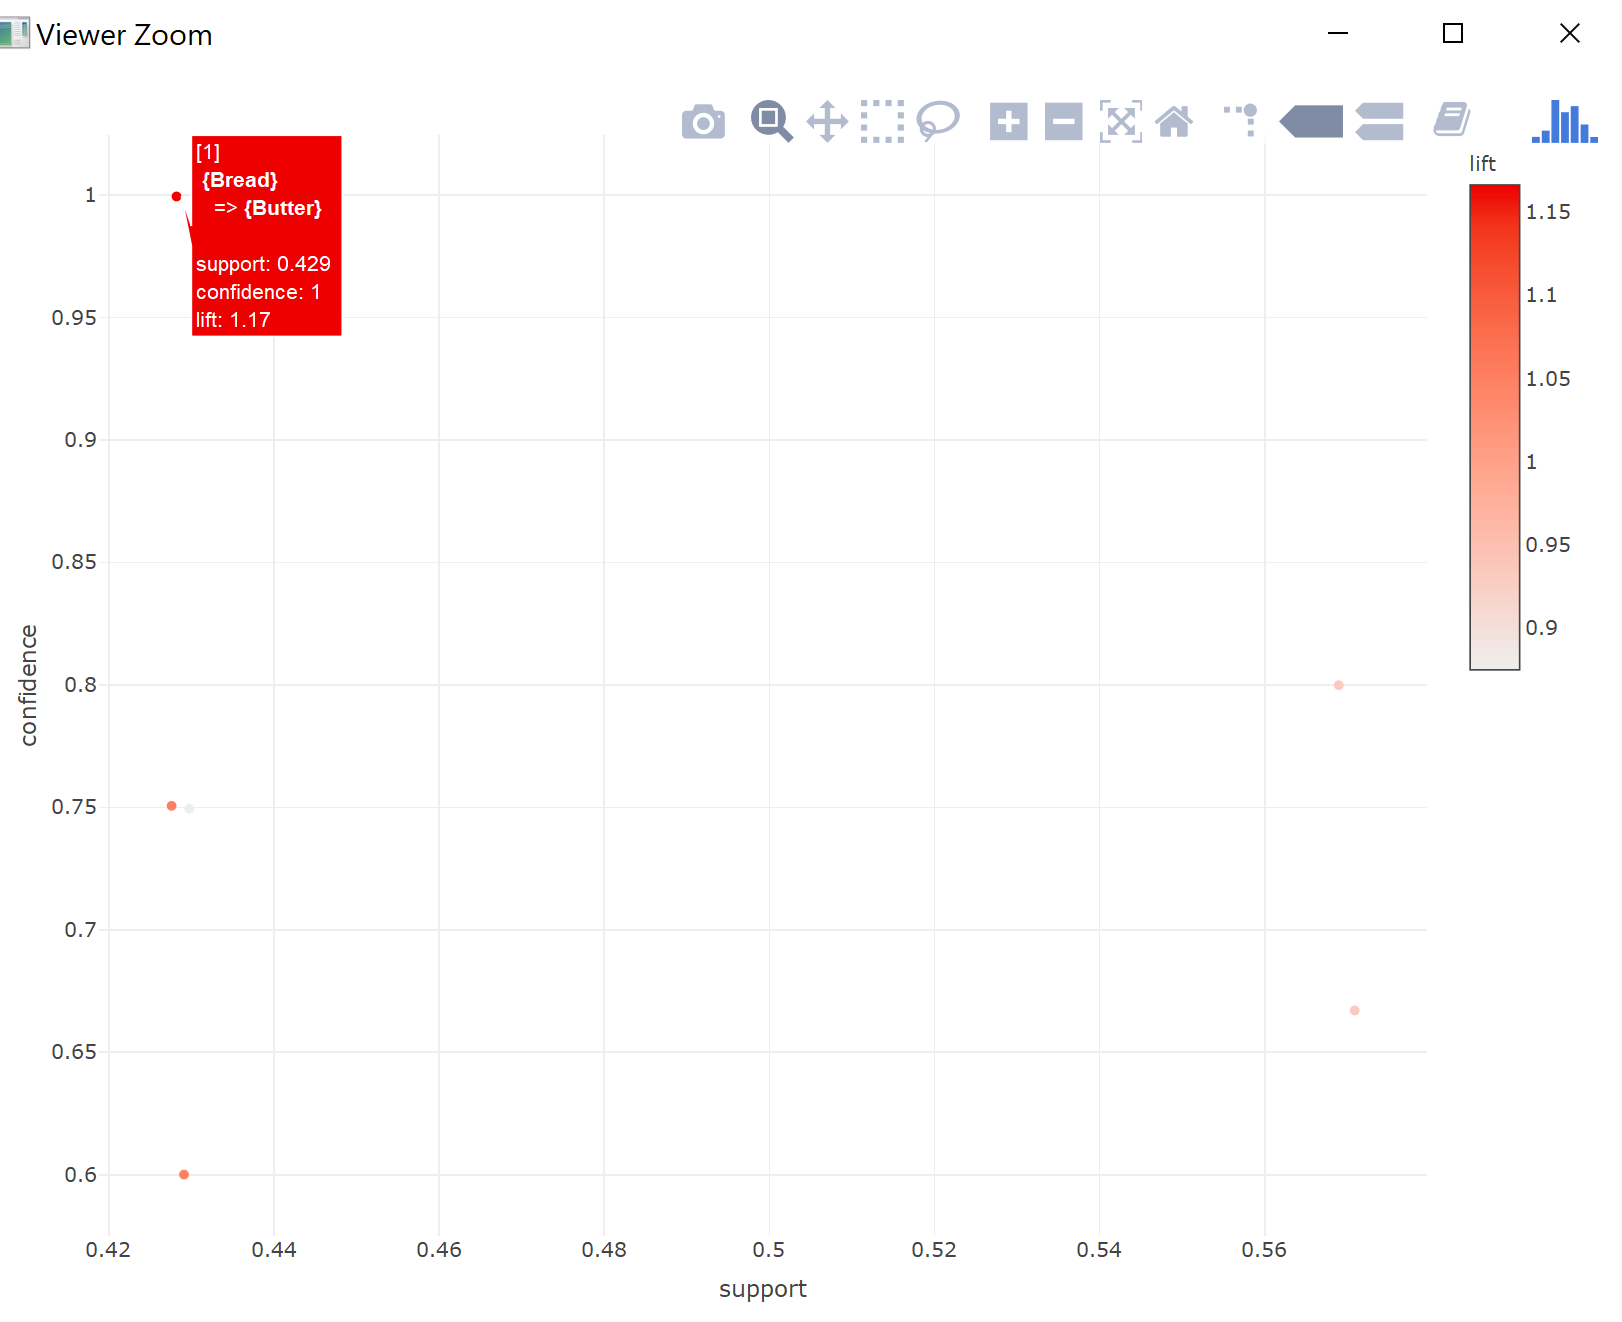
交互式 arules 图

交互式规则

plot(rules, engine = "plotly")

从静态到交互

rules_plotly

R 中的购物篮分析

让我们可视化度量!

R 中的购物篮分析

Preparing Video For Download...