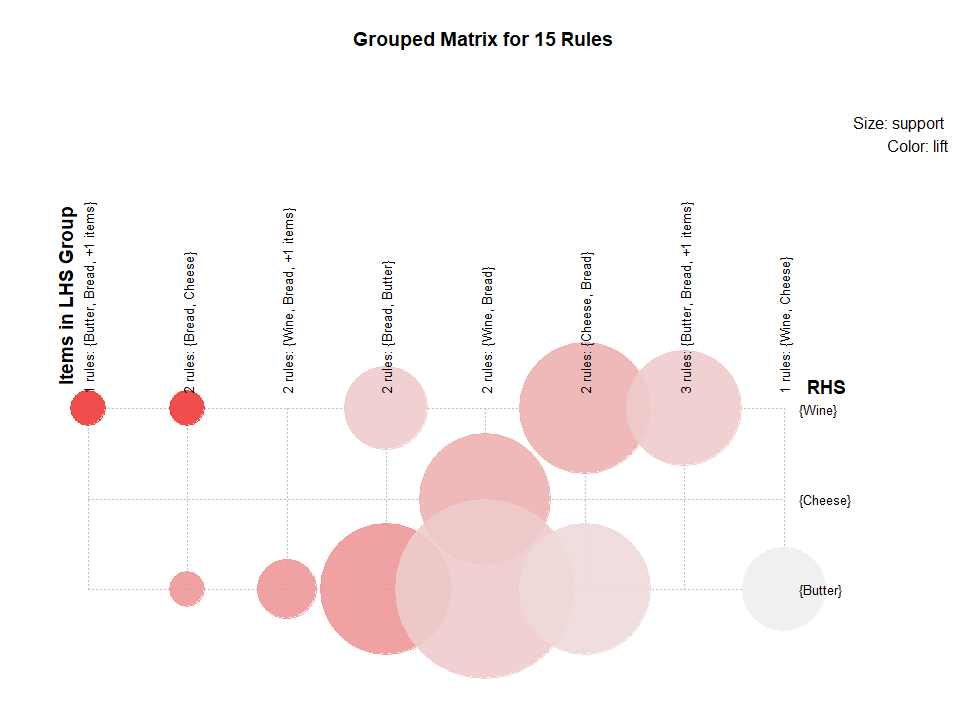
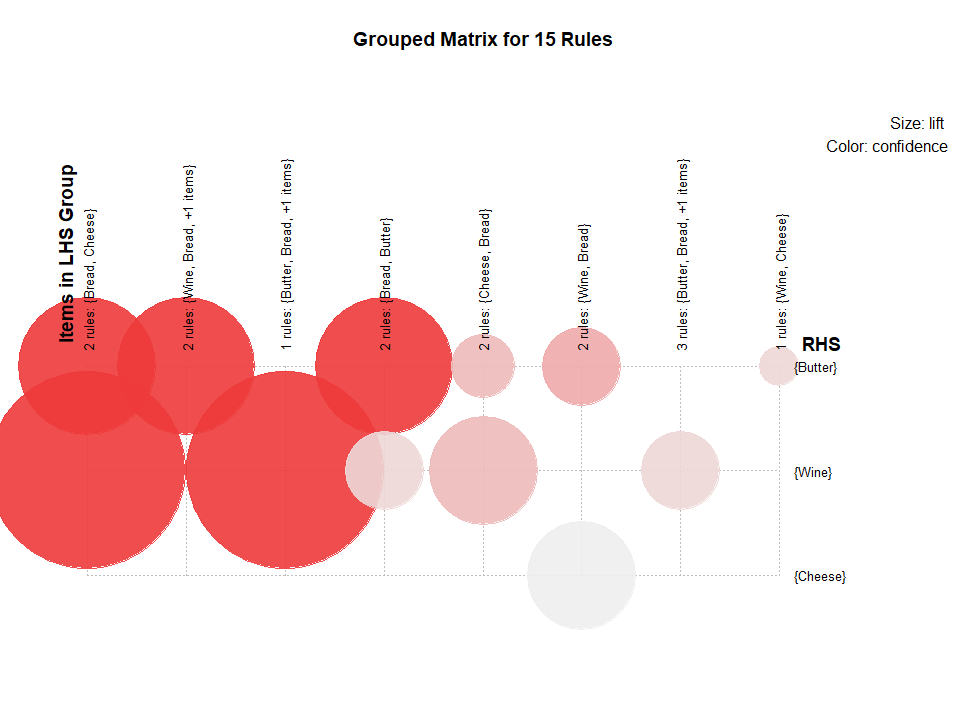
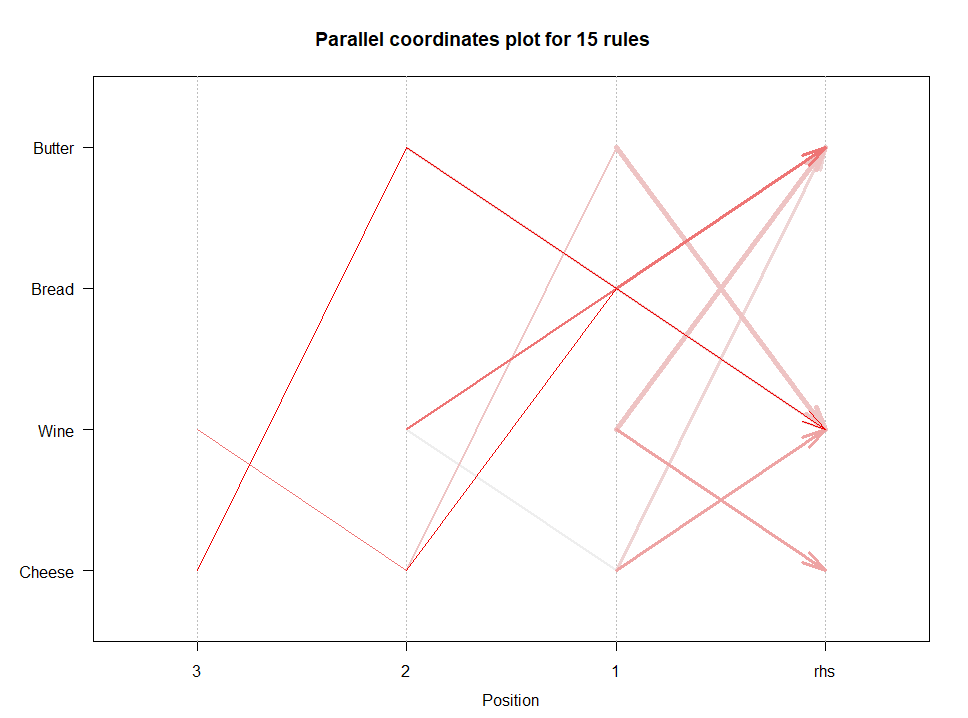
生成规则并绘图
plot(rules, method = "paracoord")
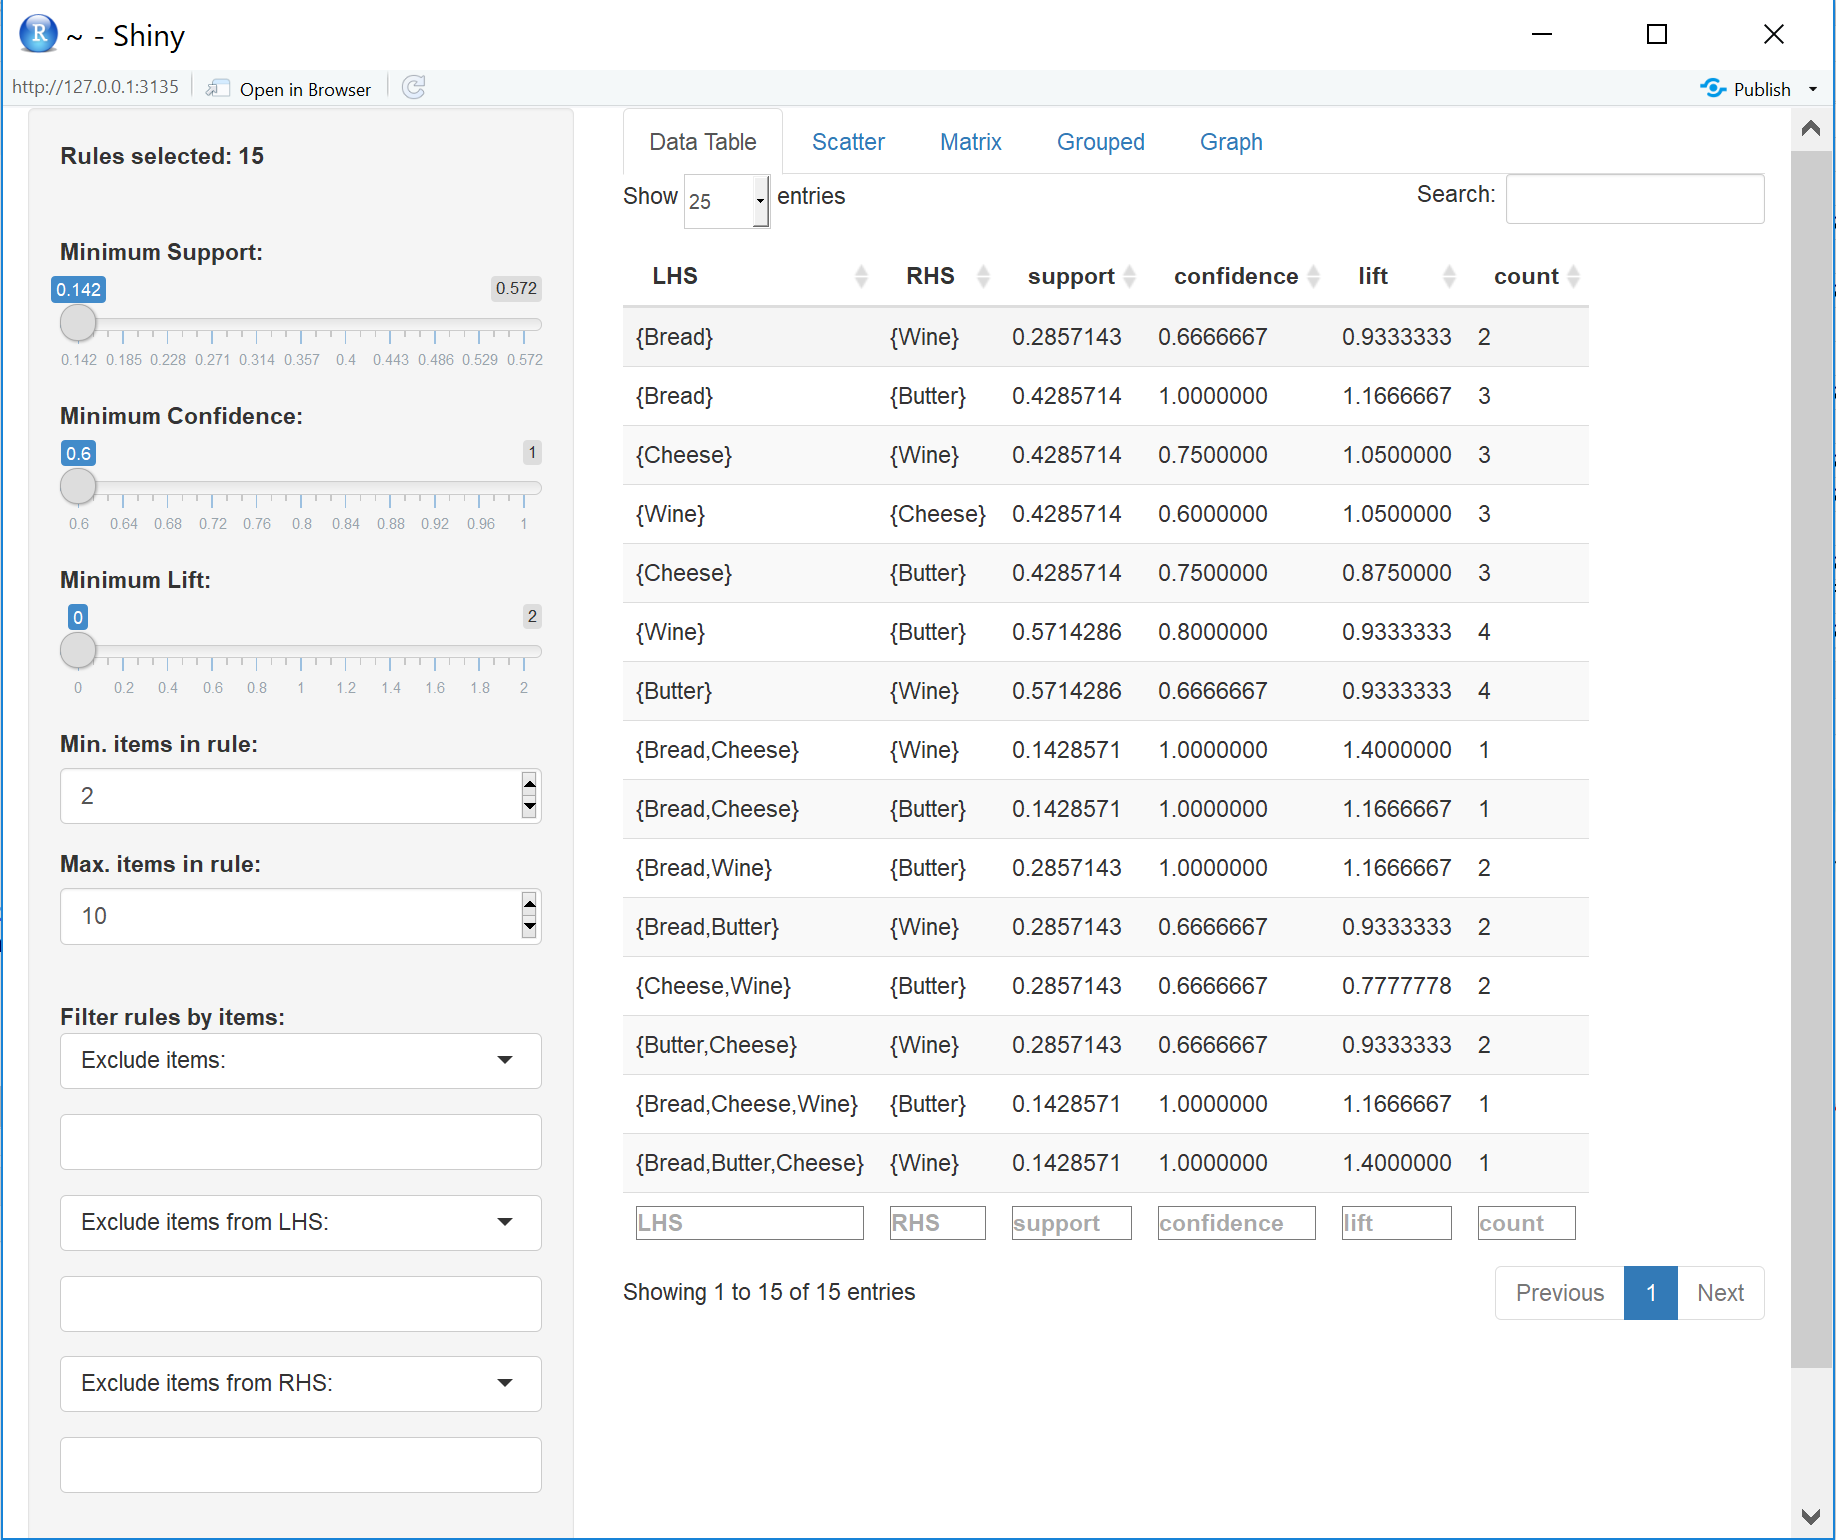
     lhs              rhs         support  confidence lift  count
[1]  {Bread}          => {Wine}   0.28     0.66       0.93  2
[2]  {Bread}          => {Butter} 0.42     1          1.16  3
[3]  {Cheese}         => {Wine}   0.42     0.75       1.05  3
[4]  {Wine}           => {Cheese} 0.42     0.6        1.05  3
[5]  {Cheese}         => {Butter} 0.42     0.75       0.87  3
[6]  {Wine}           => {Butter} 0.57     0.8        0.93  4
[7]  {Butter}         => {Wine}   0.57     0.66       0.93  4
[8]  {Bread,Cheese}   => {Wine}   0.14     1          1.4   1
[9]  {Bread,Cheese}   => {Butter} 0.14     1          1.16  1
[10] {Bread,Wine}     => {Butter} 0.28     1          1.16  2
...