差异表达数据

在 R 中使用 limma 进行差异表达分析

John Blischak

Instructor

实验数据

  1. 乳腺癌研究

    • Bioconductor 包 "breastCancerVDX"
    • 发表于 Wang 等, 2005;Minn 等, 2007
    • 344 名患者:ER+ 209,ER- 135
  2. 慢性淋巴细胞白血病(CLL)研究

    • Bioconductor 包 "CLL"
    • Sabina Chiaretti 与 Jerome Ritz 医生
    • 22 名患者:稳定 8,进展 14
在 R 中使用 limma 进行差异表达分析

R 中的数据

  • 表达矩阵(x)

  • 特征数据(f)- 特征属性

  • 表型数据(p)- 样本属性

在 R 中使用 limma 进行差异表达分析

表达矩阵

行 = 特征,列 = 样本

class(x)
"matrix"
dim(x)
22283   344


x[1:5, 1:5]
              VDX_3     VDX_5     VDX_6
1007_s_at 11.965135 11.798593 11.777625
1053_at    7.895424  7.885696  7.949535
117_at     8.259272  7.052025  8.225930
在 R 中使用 limma 进行差异表达分析

特征数据

行 = 特征,列 = 任意属性数

class(f)
"data frame"
dim(f)
22283   3


f[1:3, ]
          symbol entrez   chrom
1007_s_at   DDR1    780  6p21.3
1053_at     RFC2   5982 7q11.23
117_at     HSPA6   3310    1q23
在 R 中使用 limma 进行差异表达分析

表型数据

行 = 样本,列 = 任意属性数

class(p)
"data frame"
dim(p)
344   3


# er = +/- 为雌激素受体(Estrogen Receptor)
p[1:3, ]
      id age       er
VDX_3  3  36 negative
VDX_5  5  47 positive
VDX_6  6  44 negative
在 R 中使用 limma 进行差异表达分析

用箱线图可视化基因表达

boxplot(<y-axis> ~ <x-axis>, main = "<title>")

boxplot(<gene expression> ~ <phenotype>, main = "<feature>")
boxplot(x[1, ] ~ p[, "er"], main = f[1, "symbol"])
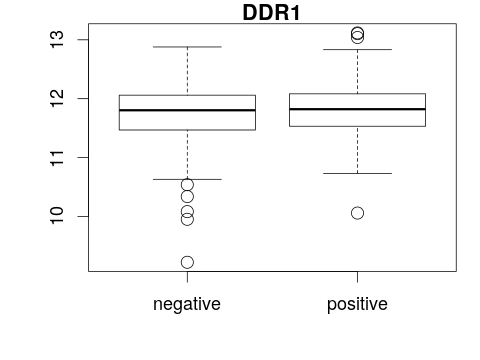
在 R 中使用 limma 进行差异表达分析

Let's practice!

在 R 中使用 limma 进行差异表达分析

Preparing Video For Download...