您的第一个 shinydashboard

使用 shinydashboard 构建仪表板

Png Kee Seng

Researcher

到目前为止

  • 在用户界面(UI)中进行线框设计
    • 头部、侧边栏、主体
  • 定义输出及其与用户输入的交互
  • server 承担此角色

drawing

header <- dashboardHeader(...)
sidebar <- dashboardSidebar(...)
body <- dashboardBody(...)

ui <- dashboardPage(header, sidebar, body)
server <- function(input, output) { ... }
shinyApp(ui, server)
使用 shinydashboard 构建仪表板

server

  • 需要定义输出与输入
  • 指定输出及其与用户输入的交互
  • 建议定义自定义辅助函数以减轻杂乱并提升可读性
    • 将这些辅助函数放在代码顶部

server 就像一位贴心的服务员,帮您将指令传达给厨房。shinyApp 中的 server 告诉 R 输入应如何与输出交互。

使用 shinydashboard 构建仪表板

添加图表

  • 回到全球足球锦标赛仪表板
  • 为 team 1 添加六边形图
  • 然后将该图放入 server 中
  • 若要为 team 2 生成同图如何处理?
soccer %>%
  ggplot(aes(x=`1_passes_compeletd`, 
             y=`1_goal_prevented`)) +
  geom_hex(bins=10) + theme_classic()
server <- function(input, output){
  output$plot1 <- renderPlot({
  fifa %>%
    ggplot(aes(x=`1_passes_compeletd`, 
               y=`1_goal_prevented`)) +
    geom_hex(bins=10) + theme_classic()
  })
}
使用 shinydashboard 构建仪表板

在 server 中定义 ggplot 对象

server <- function(input, output) {
  output$plot1 <- renderPlot({
    if (input$team == 1){

fifa %>% ggplot(aes(x=`1_passes_compeletd`, y=`1_goal_prevented`)) + geom_hex(bins=10) + theme_classic()
} else if (input$team == 2){
fifa %>% ggplot(aes(x=`2_passes_compeletd`, y=`2_goal_prevented`)) + geom_hex(bins=10) + theme_classic()
} }) }
使用 shinydashboard 构建仪表板

使用辅助函数

plot_hex <- function(team){
  if (team == 1){
    soccer %>% ggplot(aes(x=`1_passes_compeletd`, 
                        y=`1_goal_prevented`)) +
      geom_hex(bins=10) + theme_classic()
  }
  else if (team == 2){
    soccer %>% ggplot(aes(x=`2_passes_compeletd`, 
                        y=`2_goal_prevented`)) +
      geom_hex(bins=10) + theme_classic()
  }
}
使用 shinydashboard 构建仪表板

使用辅助函数

使用辅助函数

server <- function(input, output) {
  output$plot1 <- renderPlot(plot_hex(input$team)) 
}
  • 这样是否更易读?

不使用辅助函数

server <- function(input, output) {
  output$plot1 <- renderPlot({
    if (input$team == 1){
      soccer %>% ggplot(aes(x=`1_passes_compeletd`, 
              y=`1_goal_prevented`)) +
        geom_hex(bins=10) + theme_classic()
      }
    else if (input$team == 2){
      soccer %>% ggplot(aes(x=`2_passes_compeletd`, 
              y=`2_goal_prevented`)) +
        geom_hex(bins=10) + theme_classic()
      }
    })
}
使用 shinydashboard 构建仪表板

整合实现

# A complete shinydashboard

header <- dashboardHeader(title = "Soccer tournament")
sidebar <- dashboardSidebar(sidebarMenu(menuItem("Passes/goals", tabName = "passtab"), menuItem("Empty", tabName = "emptytab")))
body <- dashboardBody(tabItems( tabItem("passtab", fluidRow(box(selectInput("team", "Team number", choices = c(1,2))), box(plotOutput("plot1"))) ), tabItem("emptytab")) )
ui <- dashboardPage(header, sidebar, body)
server <- function(input, output) { output$plot1 <- renderPlot(plot_hex(input$team)) }
shinyApp(ui, server)
使用 shinydashboard 构建仪表板

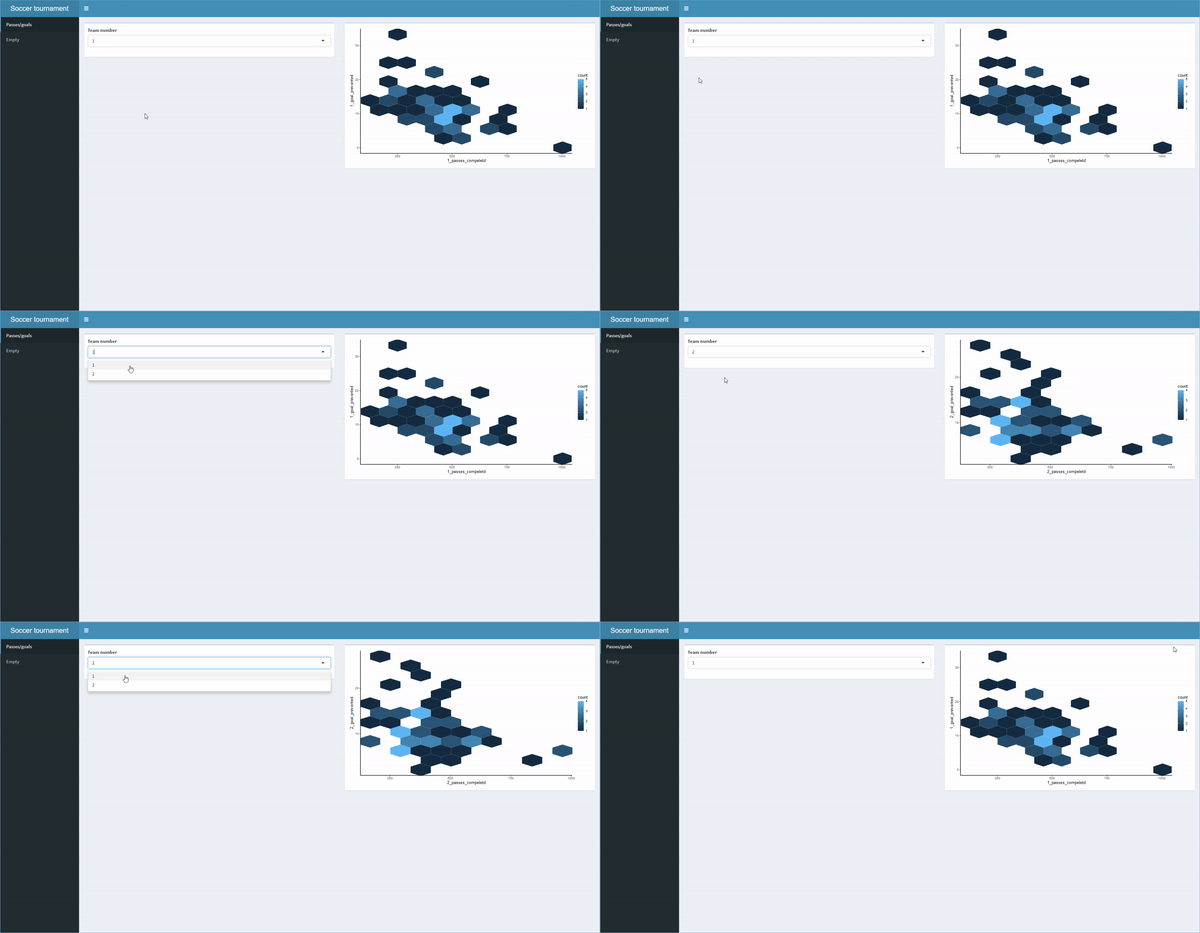
一个动画展示渲染后的 shinydashboard 外观。用户可以在不同页面或选项卡间切换,并提供输入以获得不同输出。

使用 shinydashboard 构建仪表板

让我们练习吧!

使用 shinydashboard 构建仪表板

Preparing Video For Download...