使用 shinydashboard 构建仪表板
Png Kee Seng
Researcher


dashboardHeader() 定义页眉titleWidth 参数header <- dashboardHeader(title = "Soccer tournament")
header <- dashboardHeader(title = "Analysis for global soccer tournament")
titleWidth = 400)
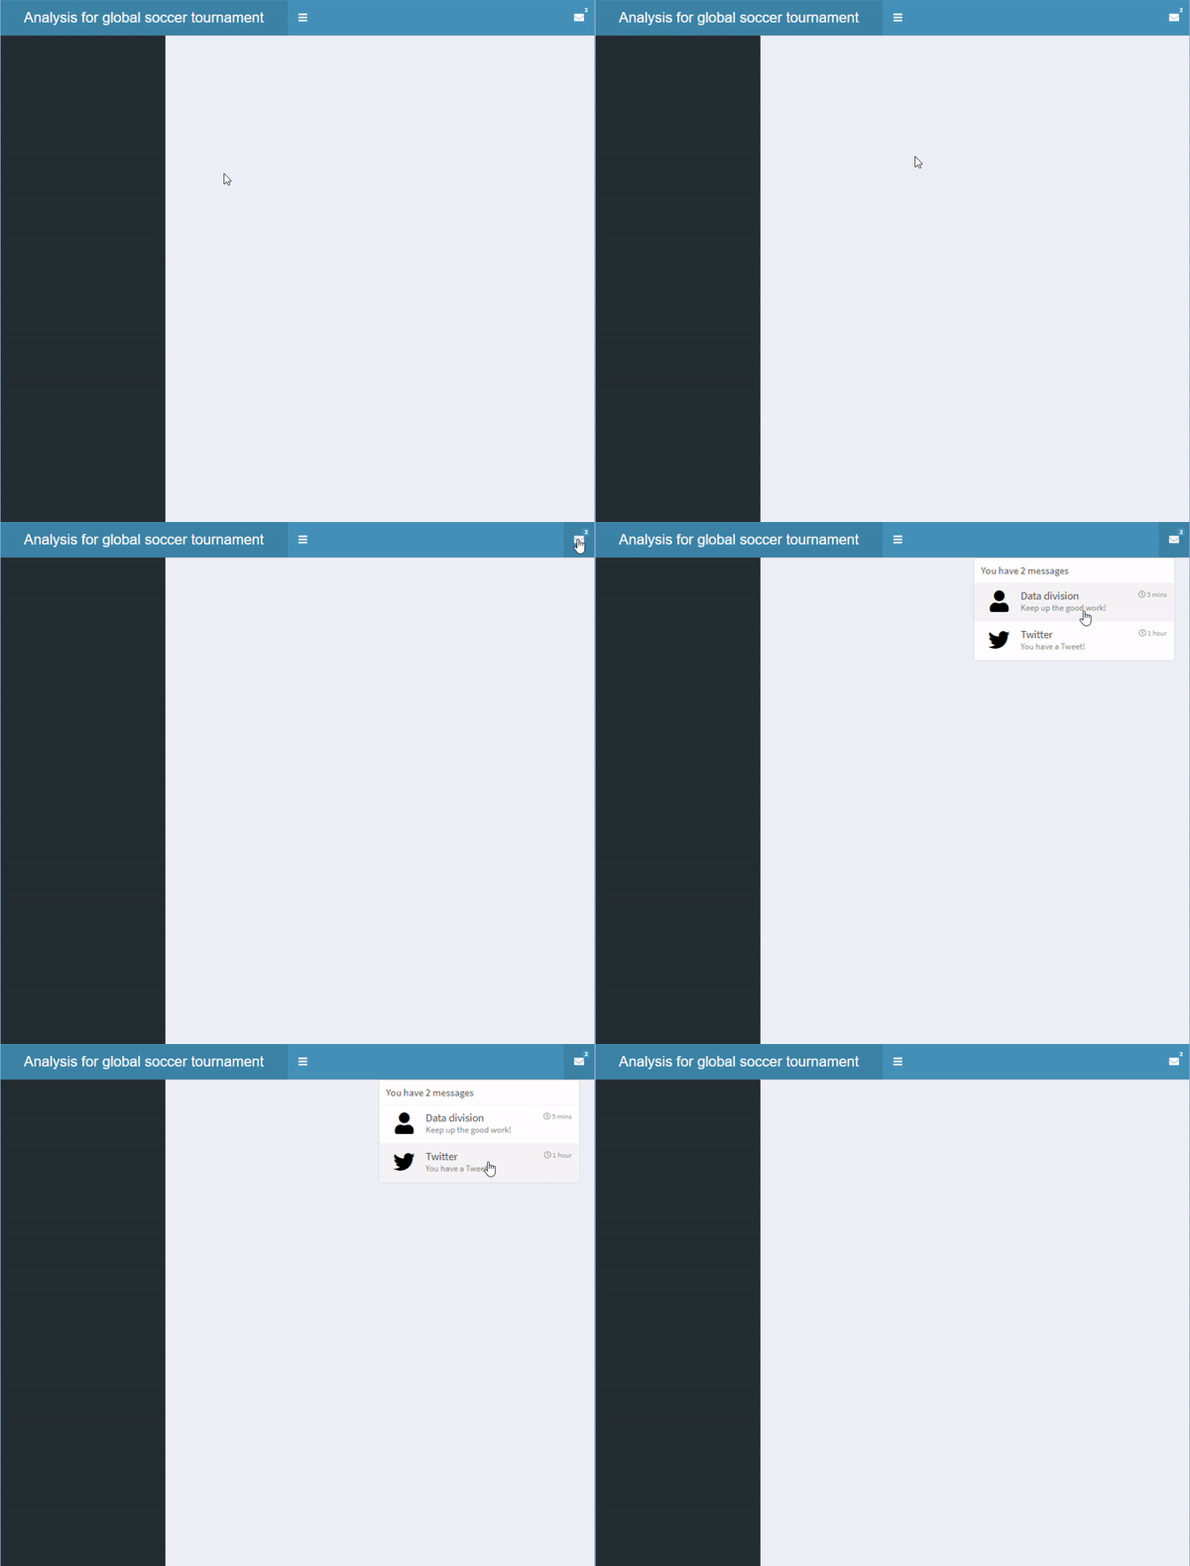
type 为 "messages" 的 dropdownMenu()messageItem()icon("user")timeheader <- dashboardHeader( title = "Analysis for FIFA world cup", titleWidth = 300, dropdownMenu(type = "messages",messageItem("Data division", "Keep up the good work!",time = "5 mins")))
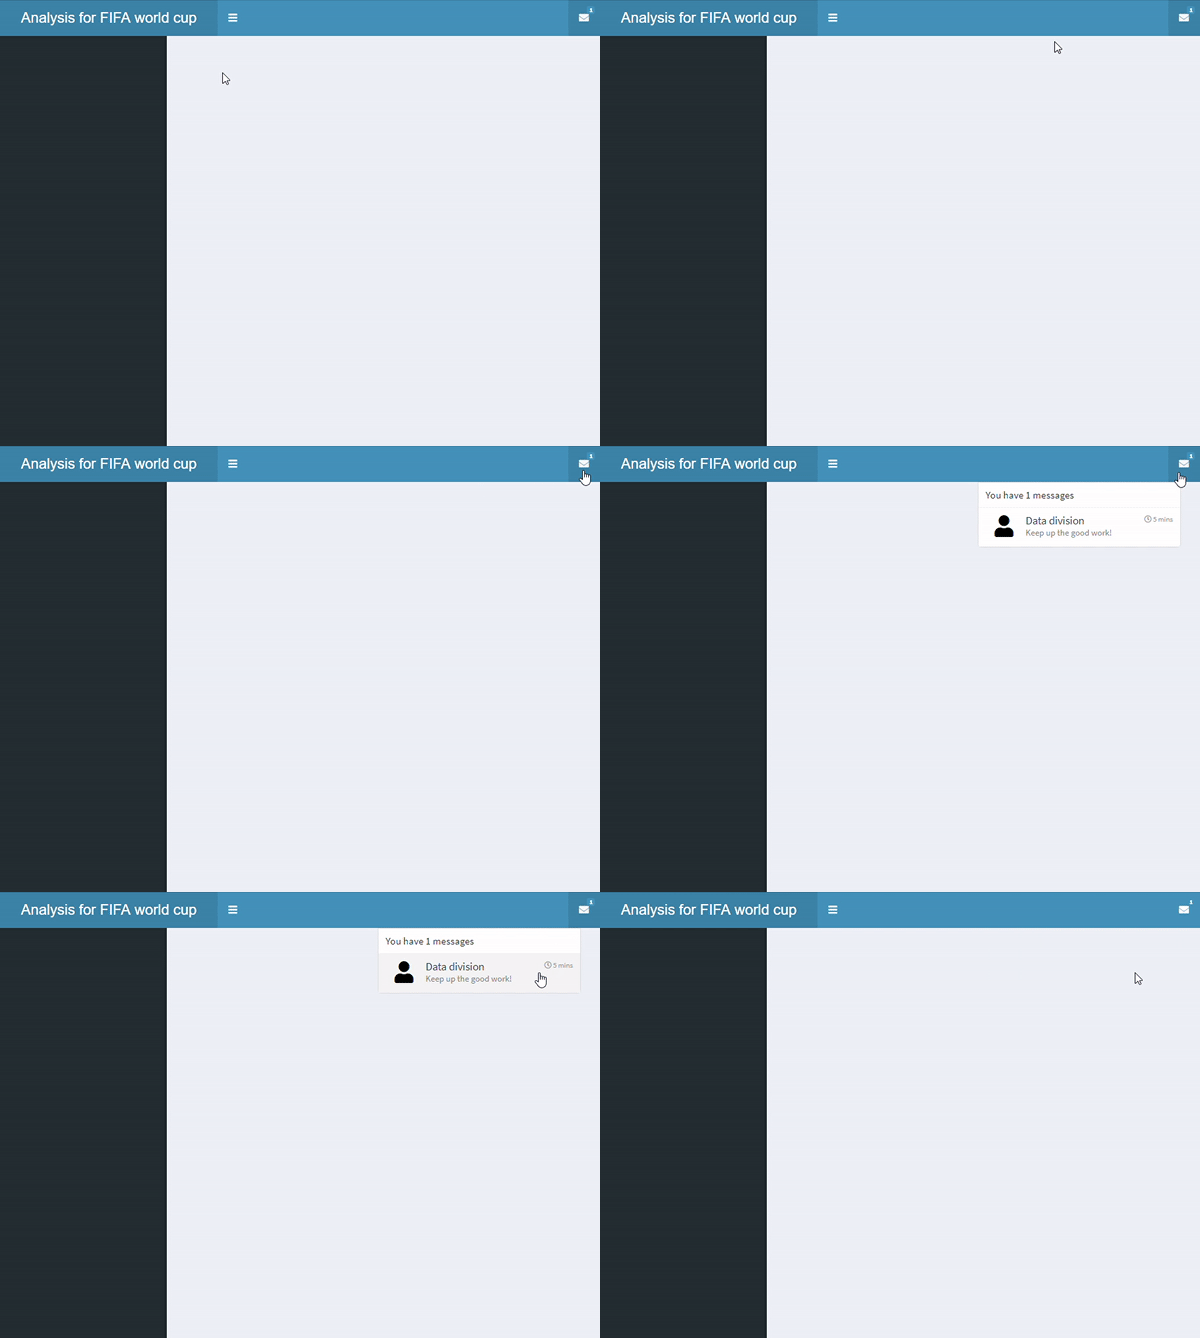
dropdownMenu() 中再添加一个名为 "Twitter" 的 messageItem()
header <- dashboardHeader( title = "Analysis for global soccer tournament", titleWidth = 400, dropdownMenu(type = "messages", messageItem("Data division", "Keep up the good work!", time = "5 mins" ),messageItem("Twitter", "You have a Tweet!", time = "1 hour", icon=icon("twitter") ) ) )
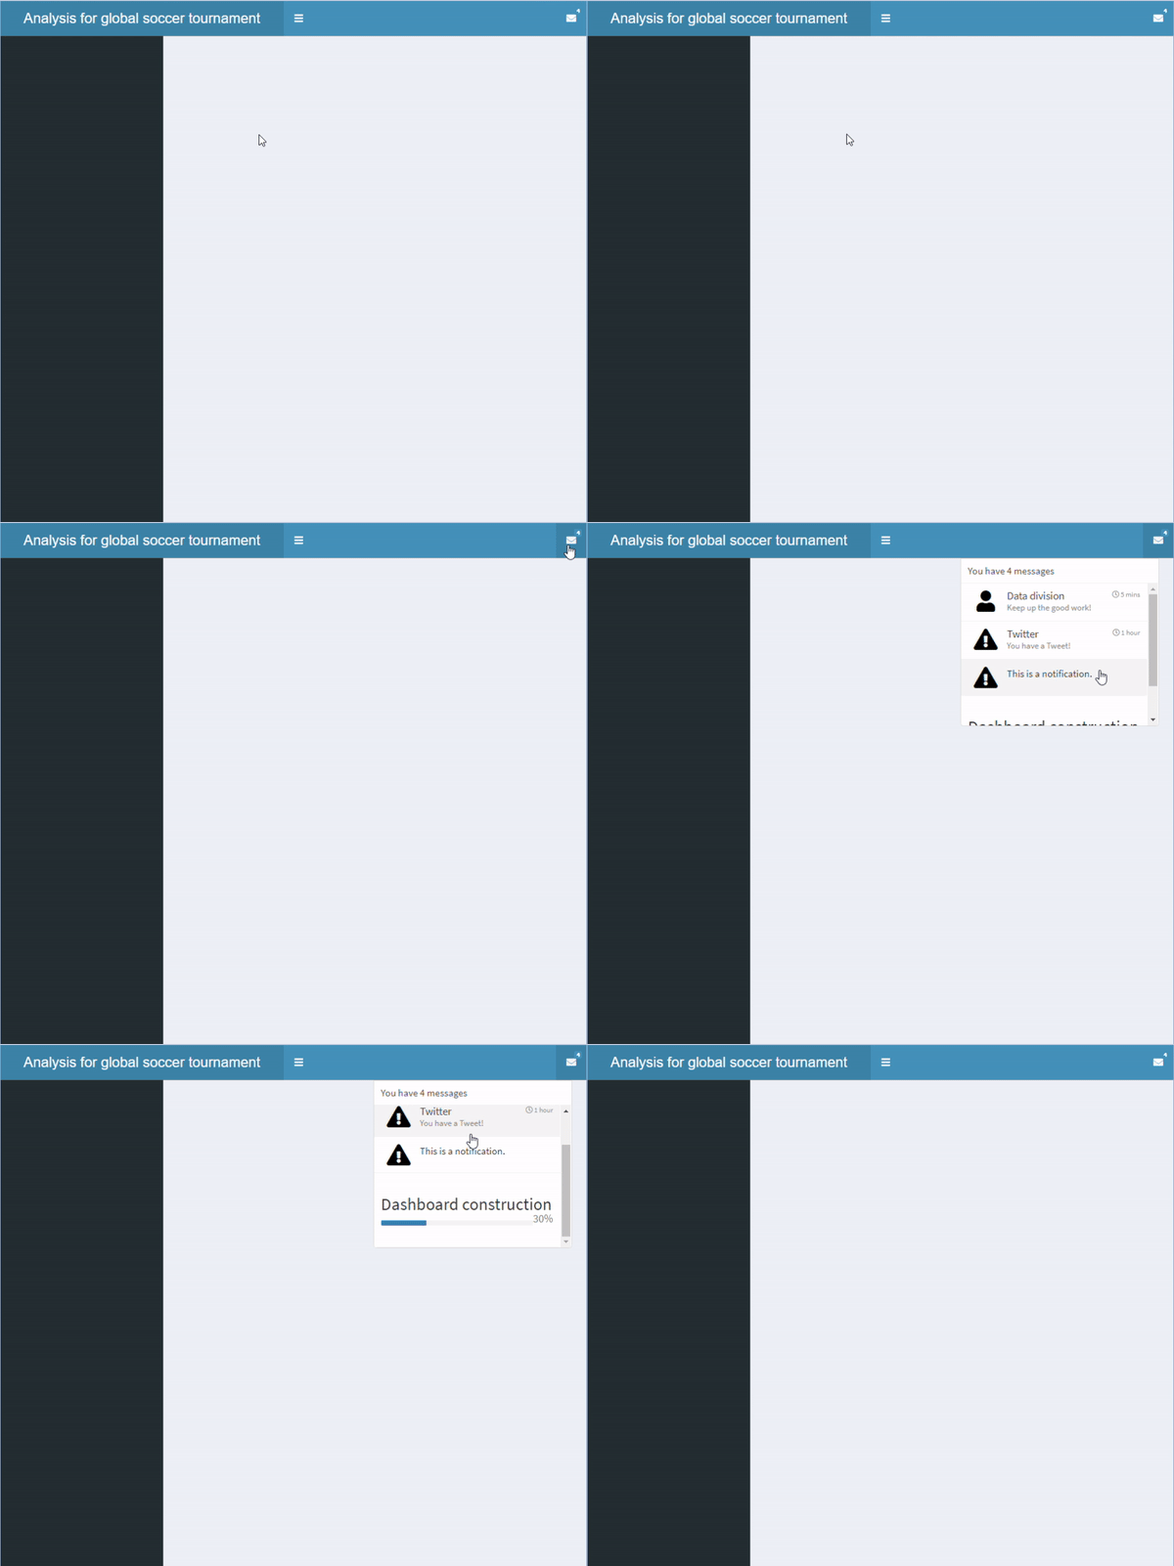
messageItem()notificationItem()taskItem()messageItem():默认图标为 icon("user")notificationItem():默认图标为 icon("exclamation-triangle")taskItem():包含进度条header <- dashboardHeader( title = "Analysis for global soccer tournament", titleWidth = 400, dropdownMenu(type = "messages",messageItem("Data division", "Keep up the good work!", time = "5 mins"), messageItem("Twitter", "You have a Tweet!", time = "1 hour", icon=icon("twitter")),notificationItem("This is a notification." ),taskItem(value = 30, color = "blue", "Dashboard construction") ))


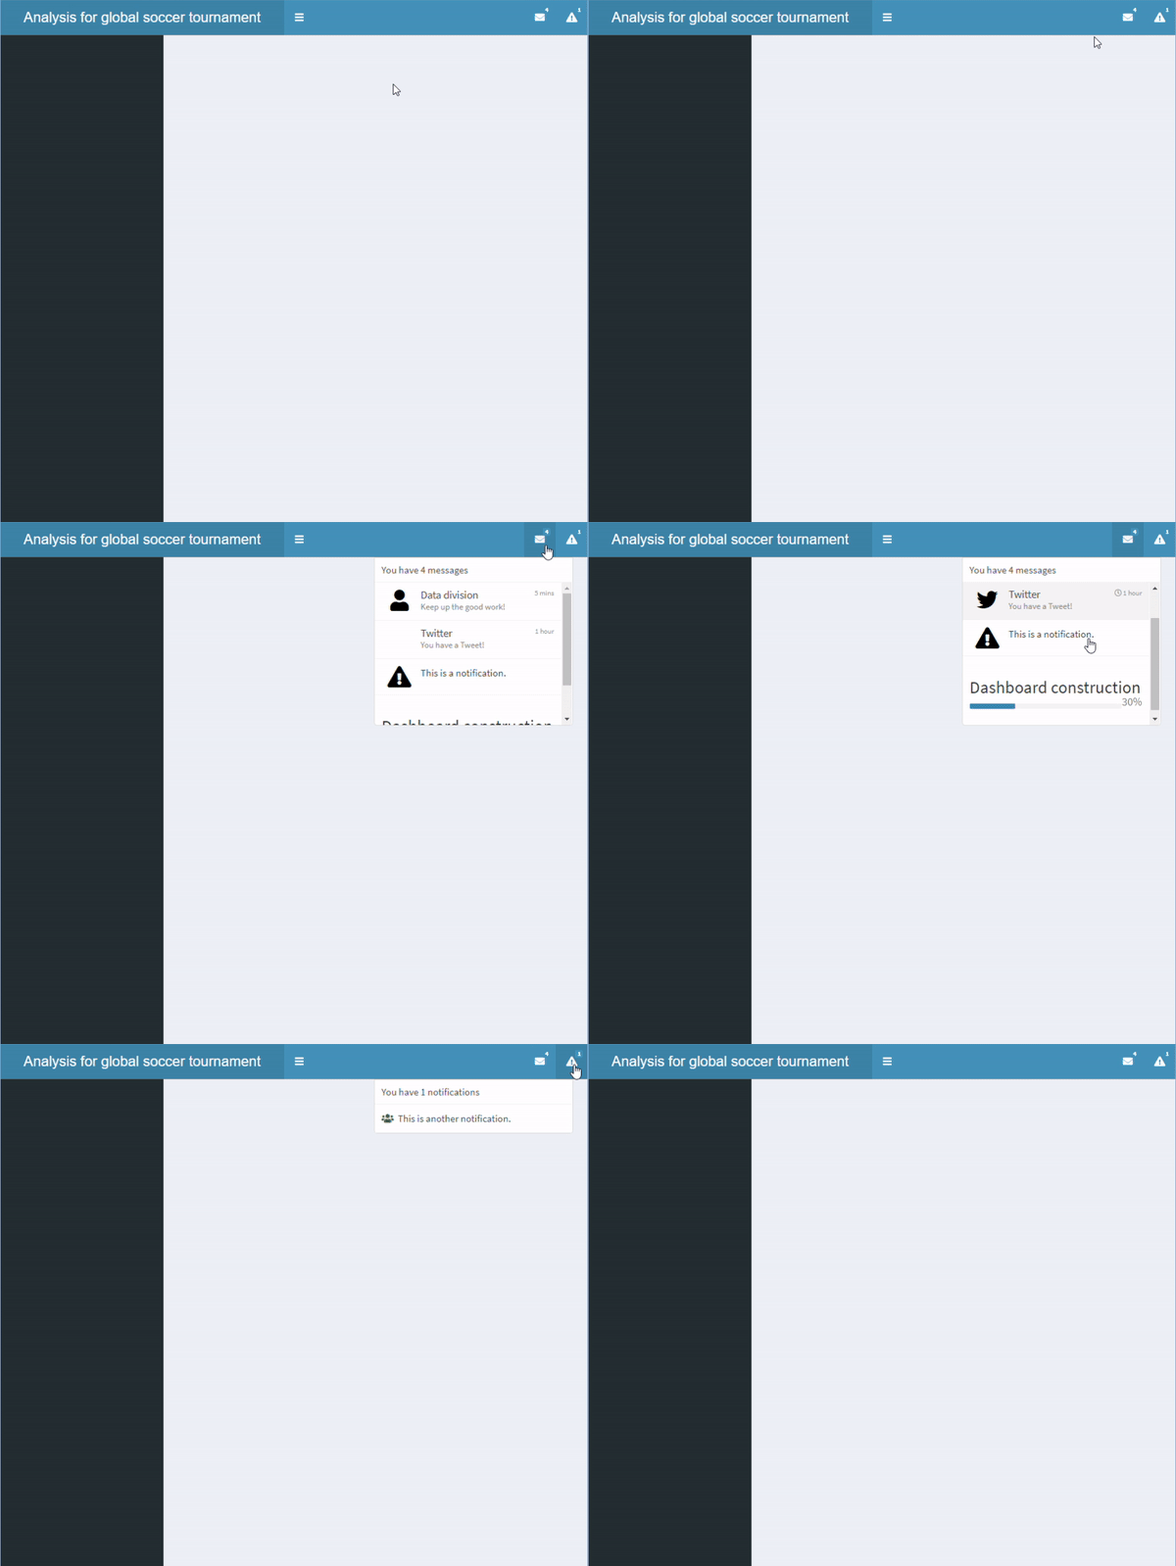
header <- dashboardHeader( title = "Analysis for global soccer tournament", titleWidth = 400,dropdownMenu(type = "messages", messageItem("Data division", "Keep up the good work!", time = "5 mins"), messageItem("Twitter", "You have a Tweet!", time = "1 hour", icon=icon("twitter")), notificationItem("This is a notification."), taskItem(value = 30, color = "blue", "Dashboard construction")),dropdownMenu(type = "notifications", notificationItem(icon = icon("users"), "This is another notification." )))
dashboardSidebar() 定义侧边栏width 调整宽度sidebarMenu() 可在 shinydashboard 中放置多页
sidebar <- dashboardSidebar()
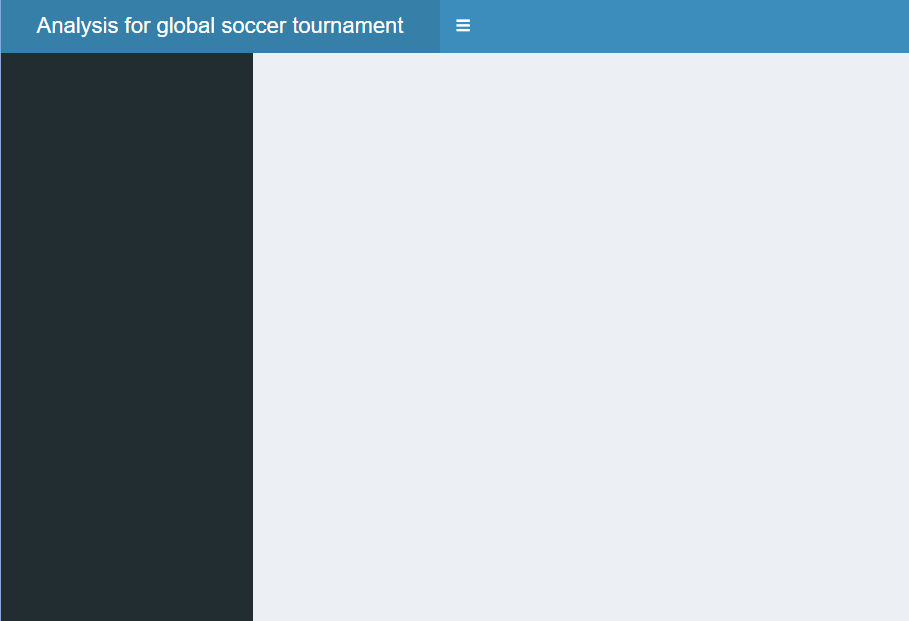
sidebar <- dashboardSidebar(width=400)
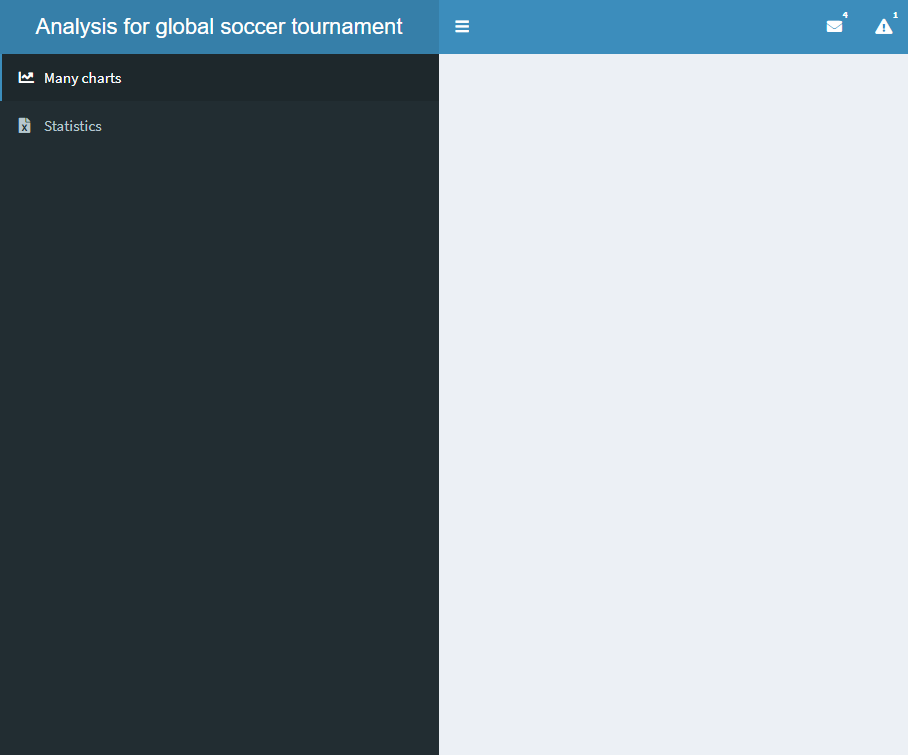
sidebar <- dashboardSidebar(width=400,
sidebarMenu(
id = "pages",
menuItem("Many charts", tabName = "charts",
icon = icon("chart-line")),
menuItem("Statistics", icon = icon("file-excel"),
tabName = "stats")
)
)
sidebar <- dashboardSidebar(disable = TRUE)
badgeLabel 与 badgeColor
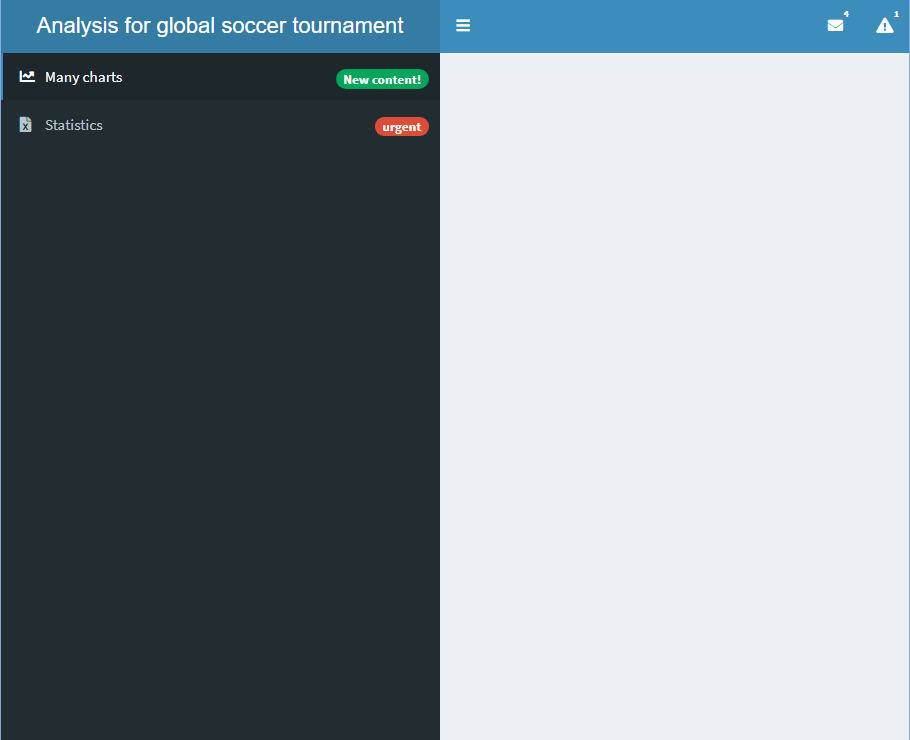
sidebar <- dashboardSidebar(width=400, sidebarMenu( id = "pages", menuItem("Many charts", tabName = "charts", icon = icon("chart-line"),badgeLabel = "New content!", badgeColor = "green"),menuItem("Statistics", icon = icon("file-excel"), tabName = "stats",badgeLabel = "urgent", badgeColor = "red")) )
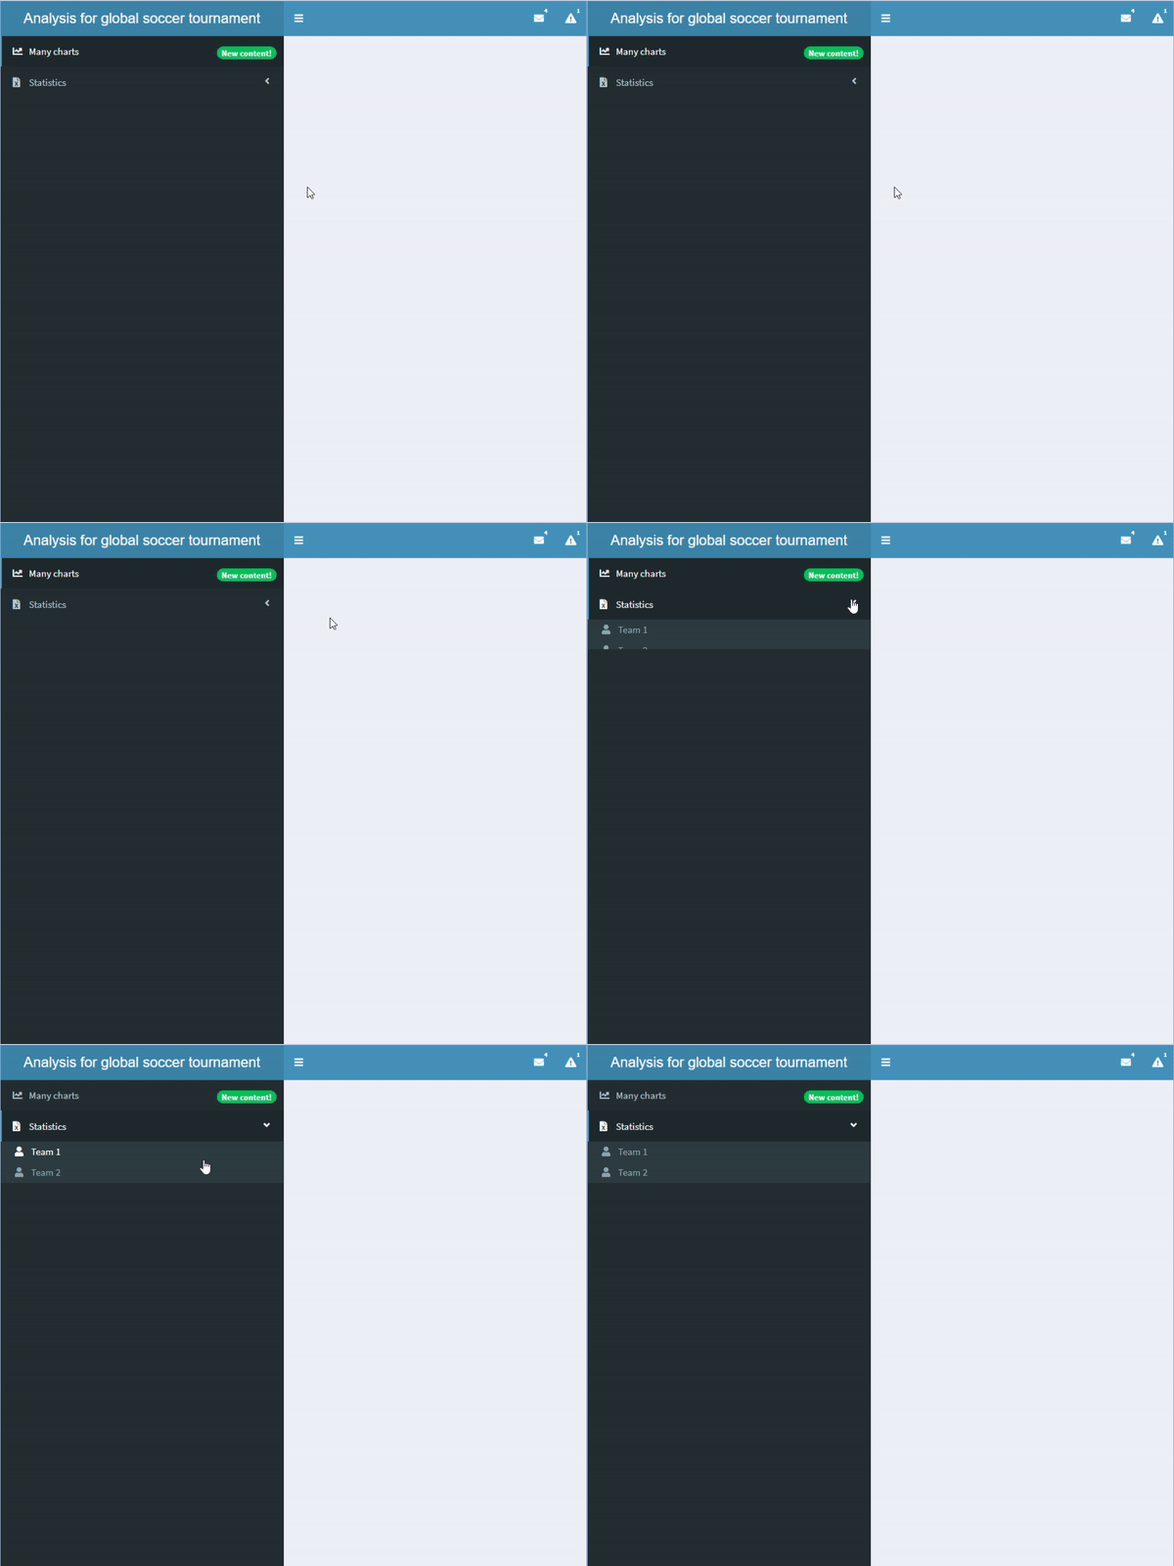
menuSubItem() 添加子选项卡
sidebar <- dashboardSidebar(width=400,
sidebarMenu(
id = "pages",
menuItem("Many charts", tabName = "charts",
icon = icon("chart-line"),
badgeLabel = "New content!",
badgeColor = "green"),
menuItem("Statistics", icon = icon("file-excel"),
tabName = "stats",
menuSubItem("Team 1", tabName = "team1",
icon=icon("user")),
menuSubItem("Team 2", tabName = "team2",
icon=icon("user")))
)
)
server 中定义输入与输出
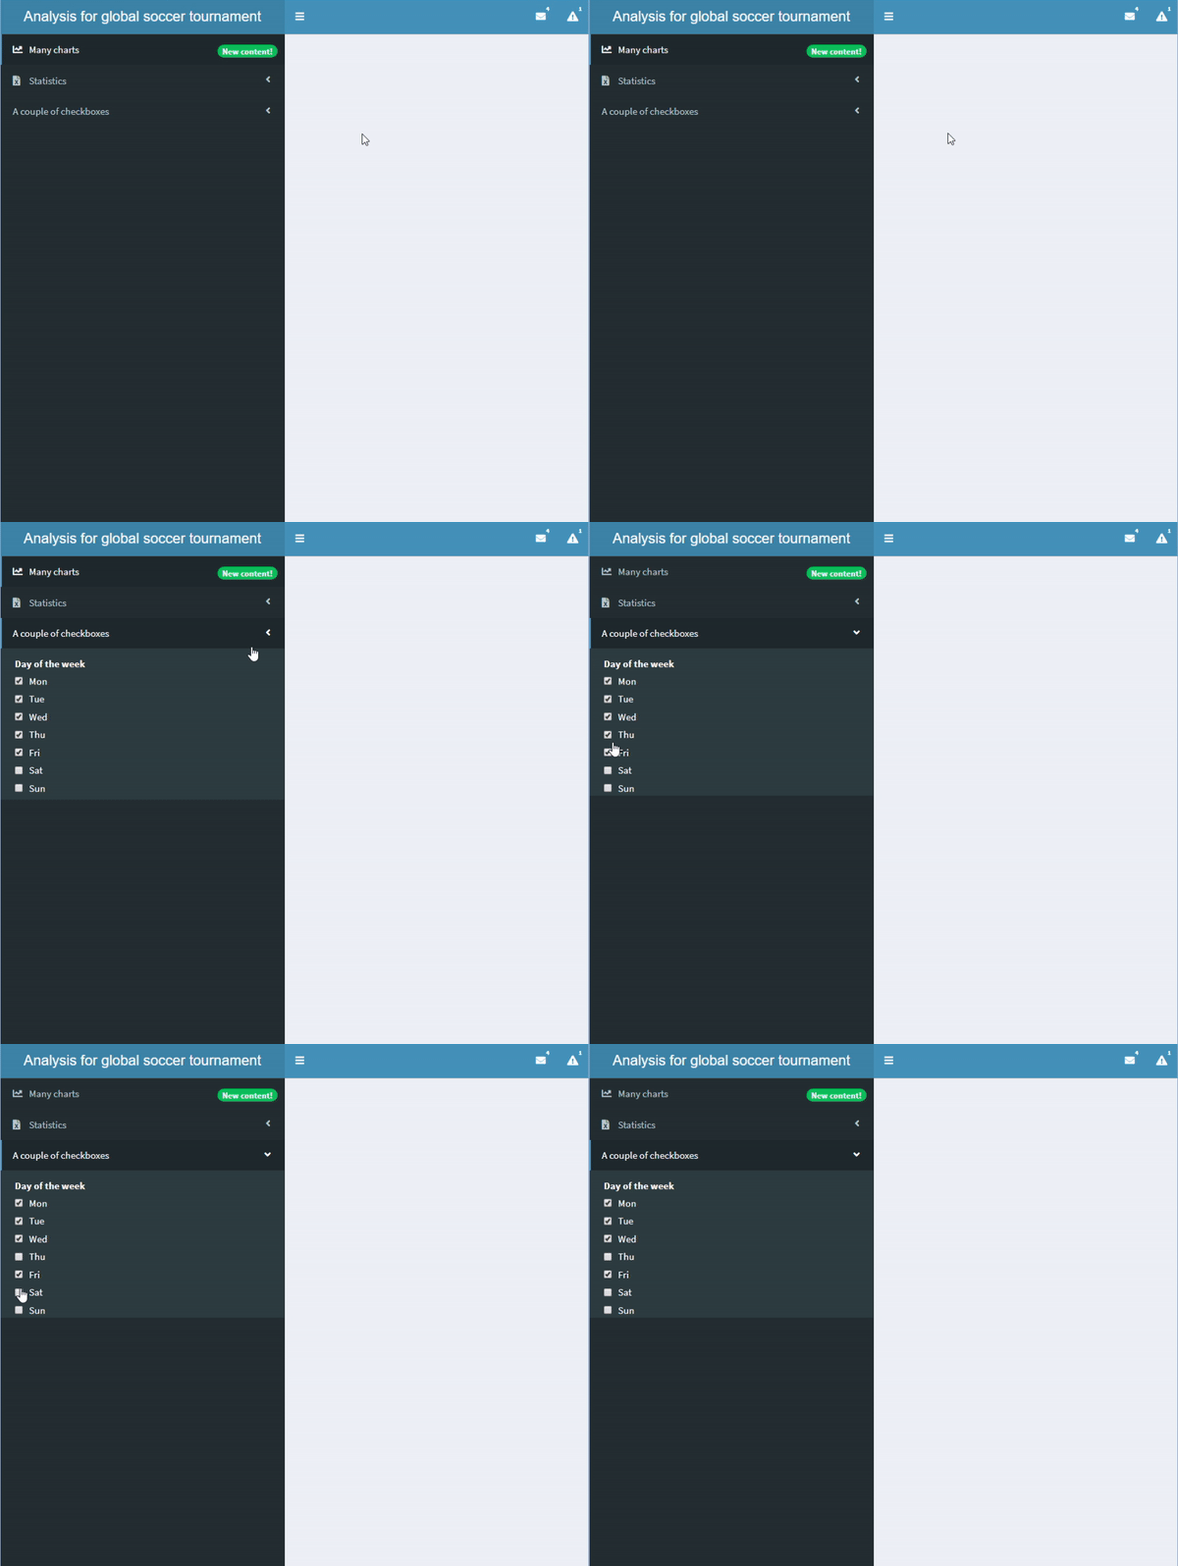
sidebar <- dashboardSidebar(width=400, sidebarMenu( id = "pages", menuItem("Many charts", tabName = "charts", icon = icon("chart-line"), badgeLabel = "New content!", badgeColor = "green"), menuItem("Statistics", icon = icon("file-excel"), tabName = "stats", menuSubItem("Team 1", tabName = "team1", icon=icon("user")), menuSubItem("Team 2", tabName = "team2", icon=icon("user"))),menuItem("A couple of checkboxes", checkboxGroupInput("checkboxes", "Day of the week", choices = c("Mon","Tue","Wed","Thu","Fri","Sat","Sun"), selected = c("Mon","Tue","Wed","Thu","Fri"))) ) )
使用 shinydashboard 构建仪表板