使用 Python 分析调查数据
EbunOluwa Andrew
Data Scientist

选取与输出变量相关的输入变量
理解不同变量对总体的影响
判断差异是偶然还是具有统计显著性

| pet_type | current_pets | time_spent | reduces_stress |
|---|---|---|---|
| dog | 1 | 420 | yes |
| dog | 1 | 180 | yes |
| dog | 4 | 30 | yes |
| dog | 1 | 30 | yes |
| dog | 1 | 60 | yes |
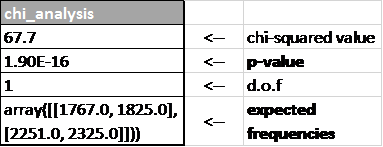
pet_typereduces_stressimport pandas as pd import scipy.stats as st data = pd.read_csv('pet_survey.csv')cross_table = pd.crosstab(data.reduces_stress, data.pet_type)chi_analysis = st.chi2_contingency(cross_table)print(chi_analysis)
|--------------------------|
| (67.7, |
| 1.9e-16, |
| 1, |
| array([[1767.0, 1825.0], |
| [2251.0, 2325.0]])) |
频数 >= 5
p 值 < 0.05
pet_owned 与 reduces_stress 有关宠物类型会影响是否感到减压

使用 Python 分析调查数据