使用 Python 分析调查数据
EbunOluwa Andrew
Data Scientist
dietary_habits.head()
| Age   | Gender | meals_per_day | eat_out_per_wk |
|-------|--------|---------------|----------------|
| 18-24 | Male   |             5 |              4 |
| 18-24 | Male   |             4 |              1 |
| 45-54 | Male   |             3 |              3 |
| 18-24 | Male   |             2 |              1 |
| 18-24 | Female |             3 |              1 |
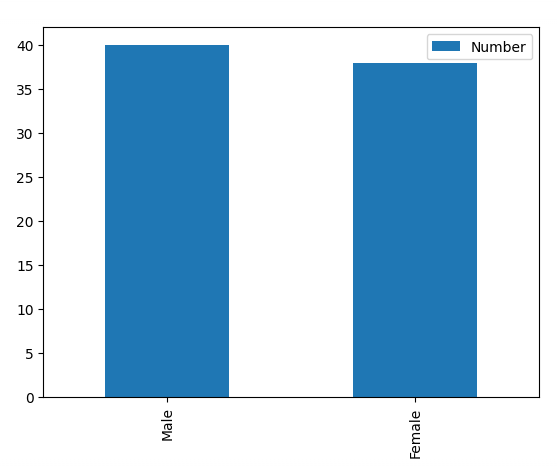
dietary_habits.Gender.value_counts().to_frame("Number")
|        | Number |
|--------|--------|
| Male   | 40     |
| Female | 38     |
索引:Gender
dietary_habits.Gender.value_counts().to_frame("Number").plot(kind='bar')
.mean()
.median()
.mode()
dietary_habits.mean()
| meals_per_day  | 3.128205 |
| eat_out_per_wk | 1.897436 |
| dtype: float64 |          |
dietary_habits.median()
| meals_per_day  | 3.0 |
| eat_out_per_wk | 1.5 |
| dtype: float64 |     |
dietary_habits.mode()
| Age   | Gender | meals_per_day | eat_out_per_wk |
|-------|--------|---------------|----------------|
| 18-24 | Male   |             3 |              1 |
print(dietary_habits.meals_per_day.max() - dietary_habits.meals_per_day.min())
3
print(dietary_habits.meals_per_day.std())
0.6518500018473766