回归分析

使用 Python 分析调查数据

EbunOluwa Andrew

Data Scientist

回归分析

  • 理解变量间的关系
  • 用于预测精确结果
  • 评估自变量对因变量的影响
  • 预测未来机会与风险
  • 将海量原始数据转为可用信息
  • 为明智决策提供依据

人们努力阻止向下的财务箭头

使用 Python 分析调查数据

使用普通最小二乘法(OLS)的线性回归

  • 线性回归模型
    • 假设 x 与 y 线性相关
    • y = m * x + b
    • 最小二乘法(OLS)
    • Sum((预测-观测)^2) => 最小化

https://seeing-theory.brown.edu/regression-analysis/index.html

1 https://seeing-theory.brown.edu/regression-analysis/index.html
使用 Python 分析调查数据

加载数据

import pandas as pd

import numpy as np
import matplotlib.pyplot as plt
import statsmodels.api as sm
exercise_data = pd.read_csv('workout_survey_data.csv') print(exercise_data.head())
| workout_minutes | calories_burned |
|-----------------|-----------------|
| 77              | 79.775152       |
| 21              | 23.177279       |
| 22              | 25.609262       |
| 20              | 17.857388       |
使用 Python 分析调查数据

定义变量

x = 自变量 y = 因变量

x = exercise_data.minutes.tolist()
y = exercise_data.calories.tolist() 
print(x,'\n',y)
| [77, 21, 22, 20, 36...           |
|----------------------------------|
| [79.7, 23.1, 25.6, 17.8, 41.8... |

调查数据

workout_minutes calories_burned
77 79.775152
21 23.177279
22 25.609262
20 17.857388
36 41.849864
使用 Python 分析调查数据

添加常数项

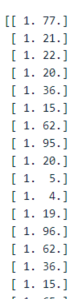
x = sm.add_constant(x)
print (x)
  • 告诉模型拟合截距 b

使用 Python 分析调查数据

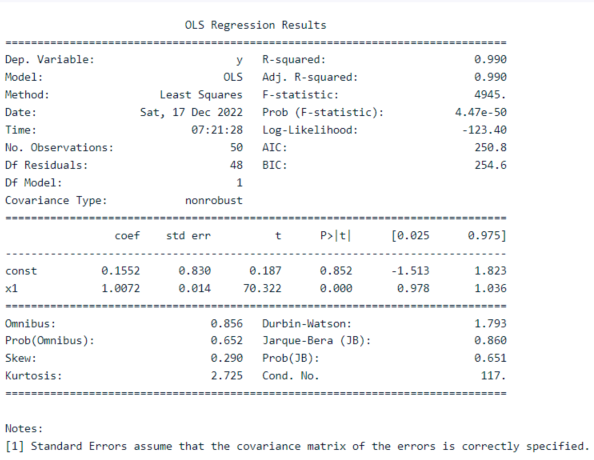
回归与拟合

result = sm.OLS(y,x).fit()
print(result.summary())

使用 Python 分析调查数据

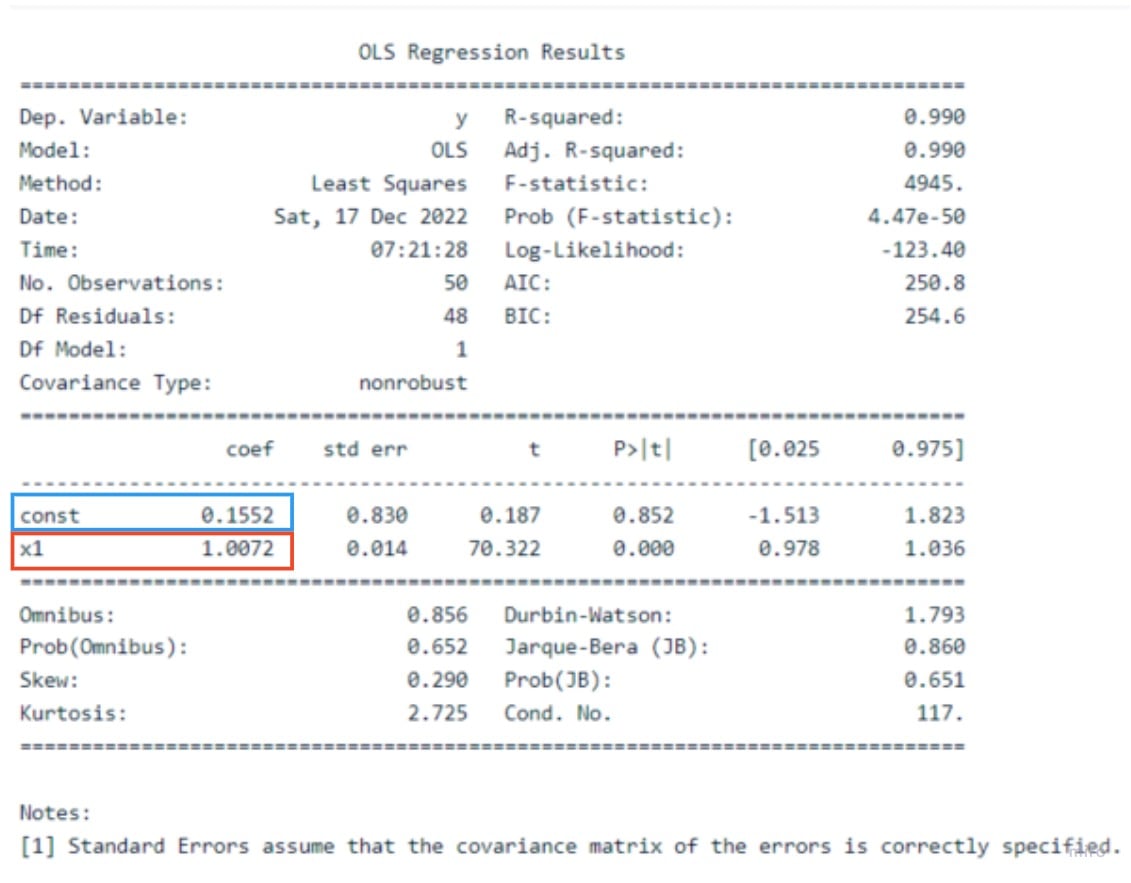
获取 m 和 b

使用 Python 分析调查数据

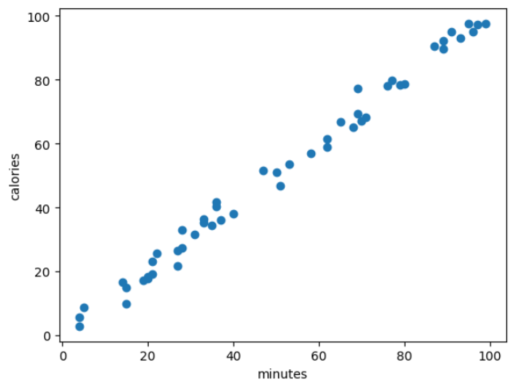
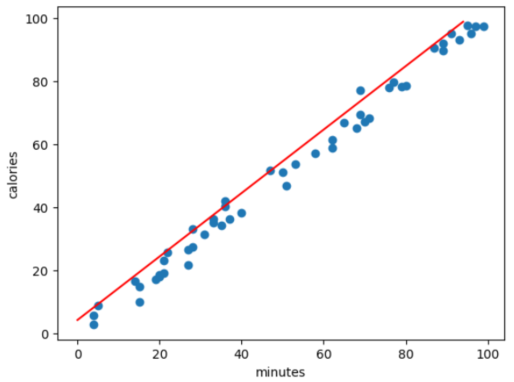
绘制原始值

x = exercise_data.minutes.tolist()
y = exercise_data.calories.tolist()
plt.scatter(x,y)
plt.xlabel('minutes')
plt.ylabel('calories')
plt.show()

使用 Python 分析调查数据

绘制回归线

max_x = exercise_data.minutes.max()
min_x = exercise_data.minutes.min()
x = np.arange(min_x, max_x, 1)

y = 1.0072*x + 0.1552
plt.plot(y, 'r') plt.show()

使用 Python 分析调查数据

预测响应

y = 1.0072 * 30 + 0.1552
print(y)
30.3712
使用 Python 分析调查数据

线性回归的优缺点

  • 优点
    • 数据线性可分时表现好
  • 缺点
    • 非线性情况仍假设线性关系

使用 Python 分析调查数据

开始练习吧!

使用 Python 分析调查数据

Preparing Video For Download...