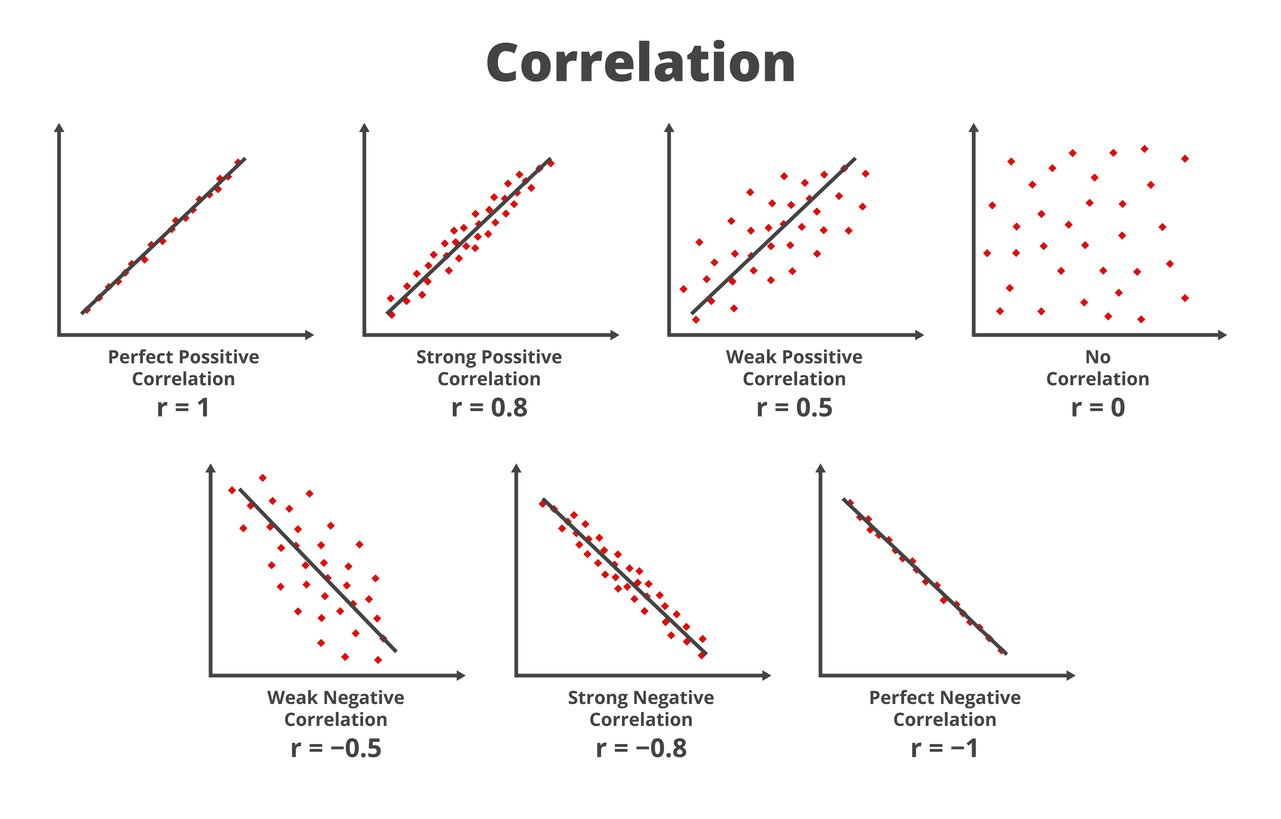
相关性

使用 Python 分析调查数据

EbunOluwa Andrew

Data Scientist

调查分析中的相关性

  • 变量数量的相互依赖
    • 一变量变动,另一变量也随之变动
  • 衡量两项调查之间的线性关系
  • 相关性并不代表因果
    • 可能存在第三个影响变量
    • 无法判断哪个变量引起另一个的变化

相关性不等于因果。文字

使用 Python 分析调查数据

相关性的强度与方向

  • 相关系数 -> r
  • 范围 -1.0 到 1.0
    • -1 或 1 = 完全关系
    • 0 = 无显著关系
    • 小于 0 = 负相关
    • 大于 0 = 正相关
  • 样本小,需更强相关才具统计显著性

拼图块之间的相关性

使用 Python 分析调查数据

.corr() 函数

  • .corr()
  • _第一列_.corr(_第二列_)

相关类型

使用 Python 分析调查数据

.corr() 示例:healthy_city

| City       | Rank | Life expectancy_years | Happiness levels |
|------------|------|-----------------------|------------------|
| Amsterdam  |    1 |                  81.2 |             7.44 |
| Sydney     |    2 |                  82.1 |             7.22 |
| Vienna     |    3 |                    81 |             7.29 |
| Stockholm  |    4 |                  81.8 |             7.35 |
| Copenhagen |    5 |                  79.8 |             7.64 |
| Helsinki   |    6 |                  80.4 |              7.8 |
| Fukuoka    |    7 |                  83.2 |             5.87 |
| Berlin     |    8 |                  80.6 |             7.07 |
| Barcelona  |    9 |                  82.2 |              6.4 |
使用 Python 分析调查数据

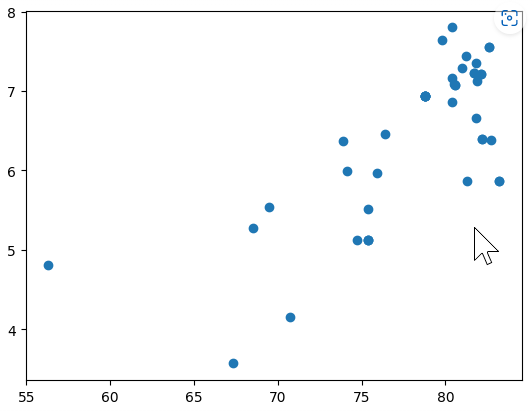
.corr() 示例:healthy_city

import matplotlib.pyplot as plt
plt.scatter(healthy_city['Life expectancy_years'],
            healthy_city['Happiness levels'])

happy_survey 散点图

使用 Python 分析调查数据

.corr() 示例:healthy_city

happy_survey['Happiness levels'].corr(
  happy_survey['Life expectancy_years'])
0.7245870841569987
使用 Python 分析调查数据

Passons à la pratique !

使用 Python 分析调查数据

Preparing Video For Download...