调查分析中的推断统计

使用 Python 分析调查数据

EbunOluwa Andrew

Data Scientist

调查分析中的推断统计入门

  • 变量间的关联
  • 样本对总体的代表性
  • 因果关系
使用 Python 分析调查数据

示例情境

车里的少女,母亲坐在旁边

开心的年轻女白领

使用 Python 分析调查数据

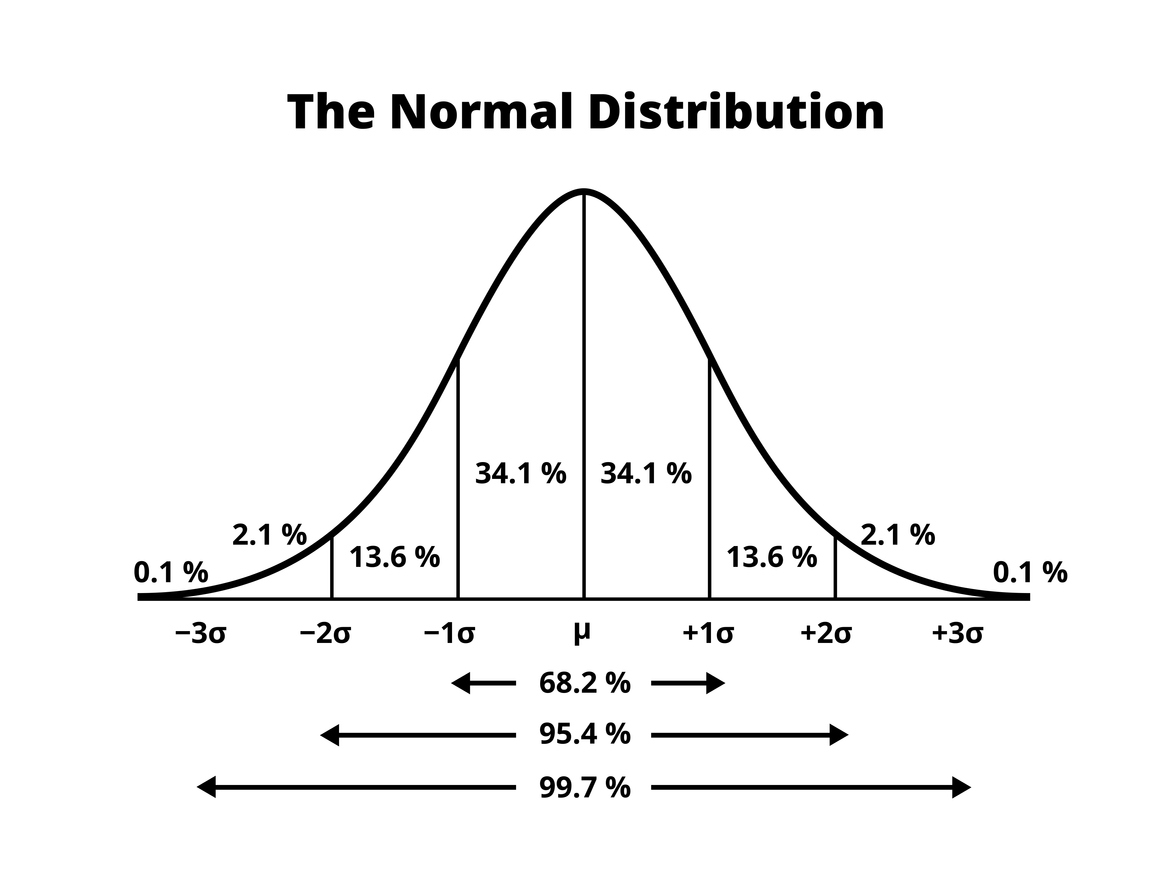
Z 分数

  • 正值 = 高于均值
  • 负值 = 低于均值
  • 绝对值大于 3:
    • 不常见的值
  • scipy.stats.zscore()

高斯分布

使用 Python 分析调查数据

人口统计调查示例

print(survey)
| Gender | Age | Height | Weight |
|--------|-----|--------|--------|
| female |  20 |    163 |     48 |
| female |  19 |    163 |     58 |
| female |  20 |    176 |     67 |
| female |  20 |    170 |     59 |
| male   |  20 |    186 |     77 |
使用 Python 分析调查数据

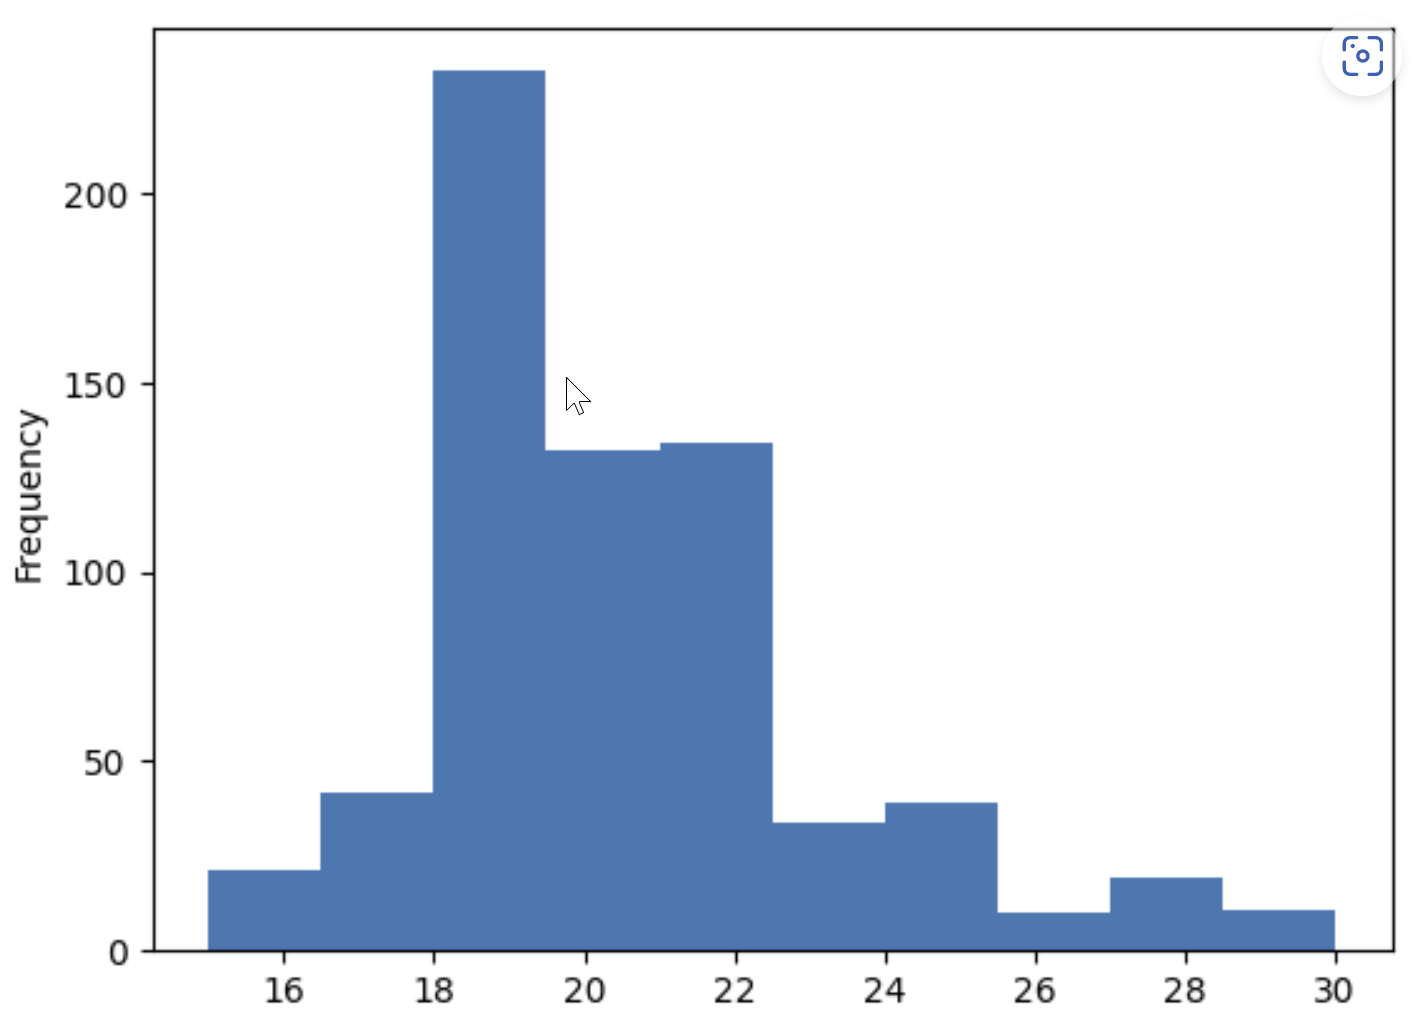
可视化 Age 列

survey.Age.plot(kind='hist')

Age 列的直方图

使用 Python 分析调查数据

计算 Age 列的 z 分数

survey['Age_zscore'] = stats.zscore(survey.Age)
print(survey)
| Gender | Age | Height | Weight | Age_zscore    |
|--------|-----|--------|--------|---------------|
| female |  20 |    163 |     48 | -0.1293116227 |
| female |  19 |    163 |     58 | -0.4955134449 |
| female |  20 |    176 |     67 | -0.1293116227 |
...
使用 Python 分析调查数据

计算 Age 列的 z 分数

survey[(survey.Age_zscore >= 3) |
       (survey.Age_zscore <= -3)]
| Gender | Age | Height | Weight | Age_zscore   |
|--------|-----|--------|--------|--------------|
| male   |  30 |    178 |     71 | 3.5327065994 |
| female |  30 |    160 |     47 | 3.5327065994 |
| male   |  29 |    189 |     96 | 3.1665047772 |
| male   |  29 |    183 |    111 | 3.1665047772 |
| male   |  29 |    173 |     81 | 3.1665047772 |
| female |  30 |    173 |     69 | 3.5327065994 |
| female |  29 |    170 |     58 | 3.1665047772 |
...
使用 Python 分析调查数据

Z 分数分析

手持信用卡的商务人士 - 摄影:rupixen.com,来源 Unsplash

使用 Python 分析调查数据

开始练习吧!

使用 Python 分析调查数据

Preparing Video For Download...