统计建模技术

使用 Python 分析调查数据

EbunOluwa Andrew

Data Scientist

为何在问卷分析中使用统计建模?

  • 基于变量关系进行预测
  • 支持可视化工具
    • 见解更易记住

图片来源:Chris Liverani,Unsplash - 手持黑色智能手机,前方黑色屏幕监视器

1 图片来源:Chris Liverani,Unsplash
使用 Python 分析调查数据

何时使用统计建模技术

  • 数据复杂
  • 变量间相互影响
  • 预测结果

图片来源:Tyler Easton,Unsplash - 墙上各种数字

1 图片来源:Tyler Easton,Unsplash
使用 Python 分析调查数据

示例统计建模技术

  • 线性回归
  • 双样本 t 检验
  • 卡方检验

图片来源:Алекс Арцибашев,Unsplash - 递增的方块柱

使用 Python 分析调查数据

线性回归模型

  • 线性回归模型
    • 假设 x 与 y 存在线性关系
    • y = m*x + b
    • y = 因变量
    • x = 自变量
    • m = 斜率
    • b = 截距

图片来源:Seeing Theory-Brown.edu - 点云中的最佳拟合直线

1 图片来源:Seeing Theory-Brown.edu
使用 Python 分析调查数据

问卷分析中的线性回归

employee gender company_type wfh_available mental_fatigue_score burn_rate
fff200 Male Service No 3 0.24
fff500 Female Service Yes 5.7 0.45
fff700 Female Service Yes 5.8 0.49
fff300 Female Service Yes 6.7 0.63
fff100 Female Product Yes 4.7 0.38
fff400 Male Service Yes 3.4 0.28
fff600 Female Product Yes 5.4 0.5
fffe3400 Female Product No 6.7 0.58
fffe200 Male Service Yes 6.3 0.48
fffe3000 Male Service Yes 5.4 0.41
使用 Python 分析调查数据

问卷分析中的线性回归

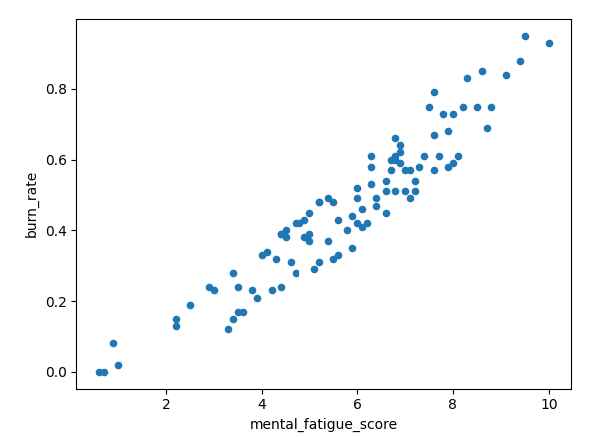
data.plot.scatter(
x='mental_fatigue_score',
y='burn_rate')
plt.show()

burn_rate 与 mental_fatigue_score 的散点图

使用 Python 分析调查数据

双样本 t 检验

  • 检验两总体均值差异是否显著
  • 原假设:两总体均值相等
  • 备择假设:两总体均值不相等

图片来源:Olesia Bahrii,Unsplash - 两串葡萄

1 图片来源:Olesia Bahrii,Unsplash
使用 Python 分析调查数据

问卷分析中的双样本 t 检验

employee gender company_type wfh_available mental_fatigue_score burn_rate
fff100 Female Product Yes 4.7 0.38
fff400 Male Service Yes 3.4 0.28
fff600 Female Product Yes 5.4 0.5
company_type burn_rate
Service 0.57
Service 0.75
Service 0.51
Service 0.57
company_type burn_rate
Product 0.51
Product 0.79
Product 0.66
Product 0.39
使用 Python 分析调查数据

卡方检验

  • 检验两个分类变量间的统计关联性
  • 原假设:变量间无显著关联
  • 备择假设:变量间有显著关联
使用 Python 分析调查数据

问卷分析中的卡方检验

  • 变量 1

    • company_type
    • Product 或 Service
  • 变量 2

    • wfh_available
    • Yes 或 No
company_type wfh_available
Product Yes
Product Yes
Product No
Service Yes
Service Yes
Product Yes
Service No
Service No
Product Yes
Service Yes
使用 Python 分析调查数据

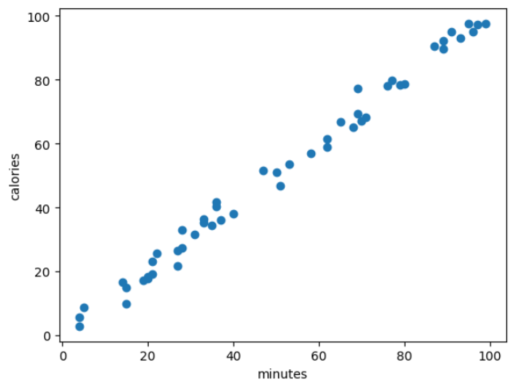
用哪种技术?— 线性回归

两个变量均为数值型

热量与分钟的散点图

使用 Python 分析调查数据

用哪种技术?— 双样本 t 检验

  • 双样本 t 检验
    • 一个变量为分类变量
    • 一个变量为数值变量

图片来源:Diana Polekhina,Unsplash - 黄色表面上的黑白卷尺

1 图片来源:Diana Polekhina,Unsplash
使用 Python 分析调查数据

用哪种技术?— 卡方检验

  • 卡方检验
    • 两个变量均为分类变量

图片来源:Element5 Digital,Unsplash - 投票剪影

1 图片来源:Element5 Digital,Unsplash
使用 Python 分析调查数据

Passons à la pratique !

使用 Python 分析调查数据

Preparing Video For Download...