purrr 中的图形
使用 purrr 掌握函数式编程基础

Auriel Fournier
Instructor
ggplot() 复习
ggplot(data = dataframe,
       aes(x = columnA,
       y = columnB))+
  geom_point()
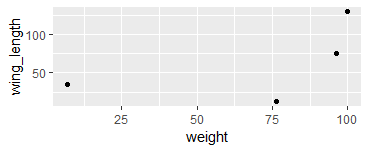
绘图与 purrr
birddf <- bird_measurements %>%
 map_df(~ data_frame(
            wing_length = .x[["wing length"]],
            weight = .x[["weight"]])) %>%
    ggplot(aes(x = weight,
            y = wing_length))+
    geom_point()

