Python 中的生存分析
Shae Wang
Senior Data Scientist
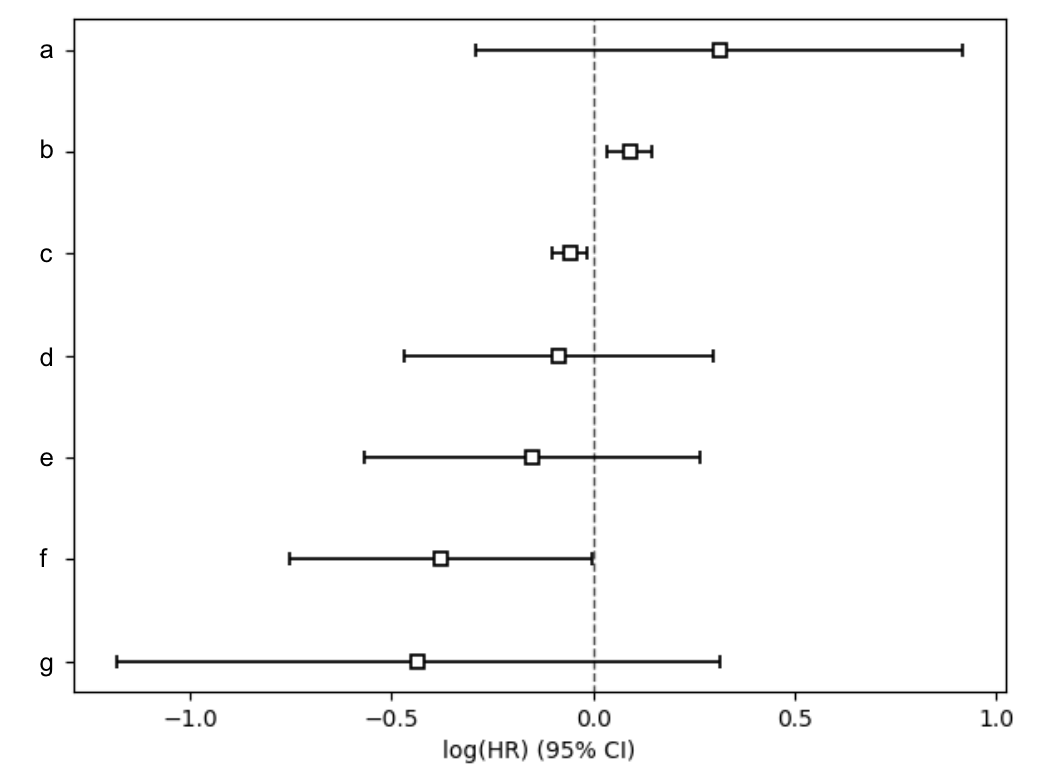
返回系数及其 95% 置信区间范围的图。
aft.plot()
plt.show()
示例图:
返回基线生存曲线与在不同协变量取值下的对比图。
aft.plot_partial_effects_on_outcome(covariates, values)
plt.show()
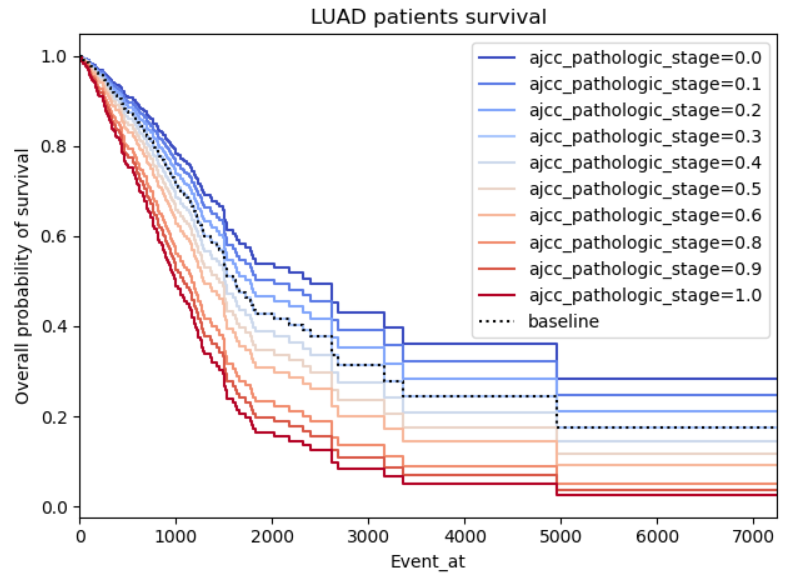
.plot_partial_effects_on_outcome()
covariates(字符串或列表):要变化的原始数据集中的协变量。values(一维或二维可迭代对象):协变量要取的值。
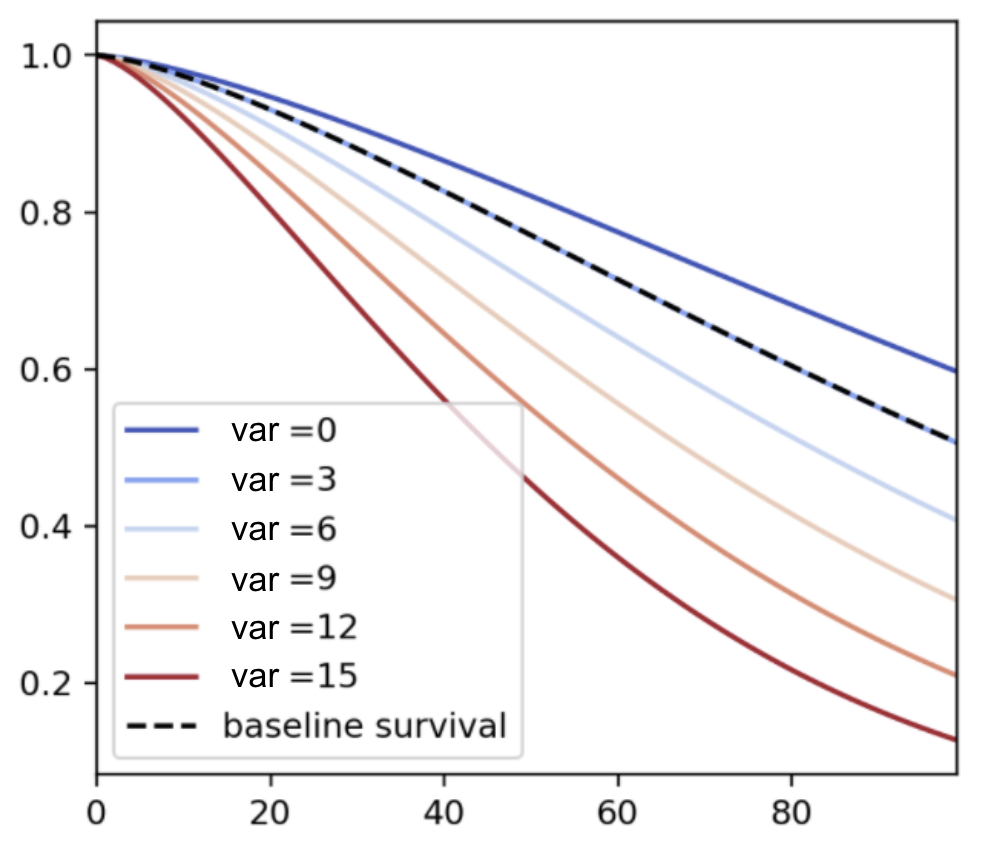
基线生存曲线:在原始数据集中所有变量取平均值时的预测生存曲线。
aft.plot_partial_effects_on_outcome(
covariates='var',
values=[0, 3, 6, 9, 12, 15]
)
plt.show()
aft.plot_partial_effects_on_outcome(
covariates='a',
values=[0, 3, 6]
)
aft.plot_partial_effects_on_outcome(
covariates='a',
values=np.arange(10)
)
aft.plot_partial_effects_on_outcome(
covariates=['a','b'],
values=[[1,2],[1,3],[2,3]]
)
数据框示例:mortgage_df
| id | house | principal | interest | property_tax | credit score | duration | paid_off |
|---|---|---|---|---|---|---|---|
| 1 | 1 | 1275 | 0.035 | 0.019 | 780 | 25 | 0 |
| 2 | 0 | 756 | 0.028 | 0.020 | 695 | 17 | 1 |
| 3 | 0 | 968 | 0.029 | 0.017 | 810 | 5 | 0 |
| ... | ... | ... | ... | ... | ... | ... | ... |
| 1000 | 1 | 1505 | 0.041 | 0.023 | 750 | 30 | 1 |
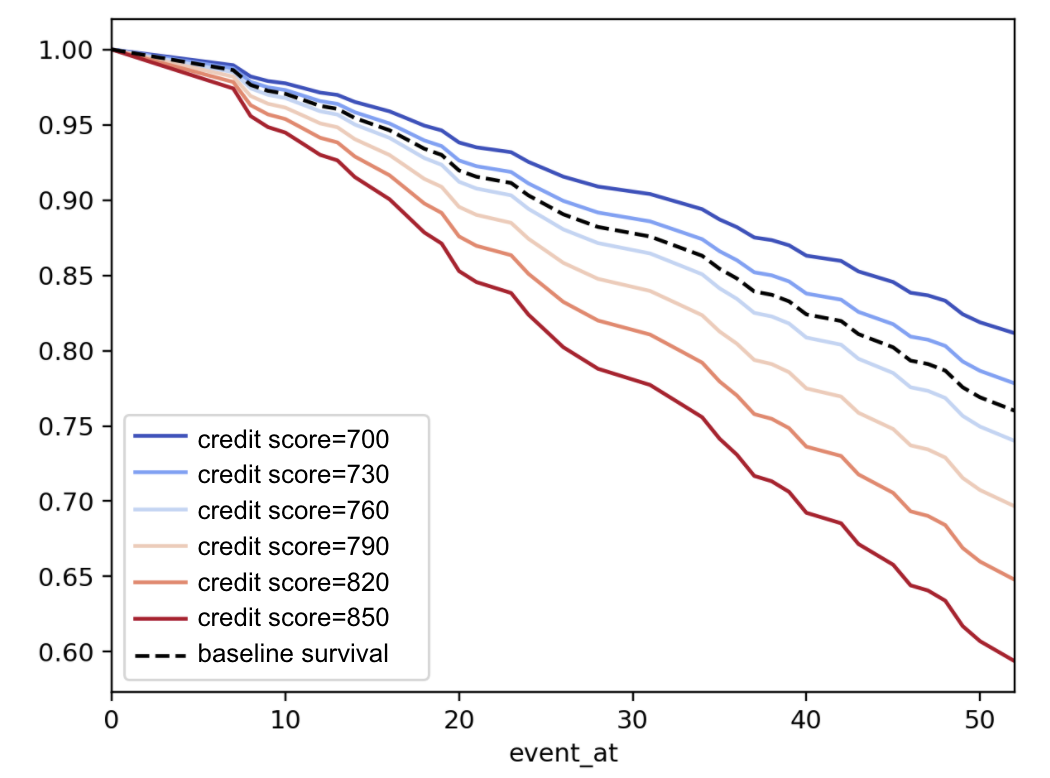
aft.plot_partial_effects_on_outcome(
covariates='credit score',
values=np.arange(700, 860, 30)
)
plt.show()


基于协变量值预测个体的生存函数。
.predict_survival_function()
参数:
X(np 数组或 DataFrame):协变量。若为 DataFrame,列顺序可任意。基于协变量值预测个体的生存中位时长。
.predict_median()
参数:
df(np 数组或 DataFrame):协变量。若为 DataFrame,列顺序可任意。在当前时长之后的条件下,预测生存函数或生存中位时长。
.predict_survival_function(X, conditional_after).predict_median(df, conditional_after)示例:
aft.predict_median(new_subject)
4.0
aft.predict_median(new_subject, conditional_after=[2])
2.0
Python 中的生存分析