Python 中的生存分析
Shae Wang
Senior Data Scientist
DataFrame 名称:mortgage_df
mortgage_df
Property type:按揭所融资房屋类型(house 或 apartment)
我们常需评估不同受试组的生存(或事件/生存概率)是否存在差异。
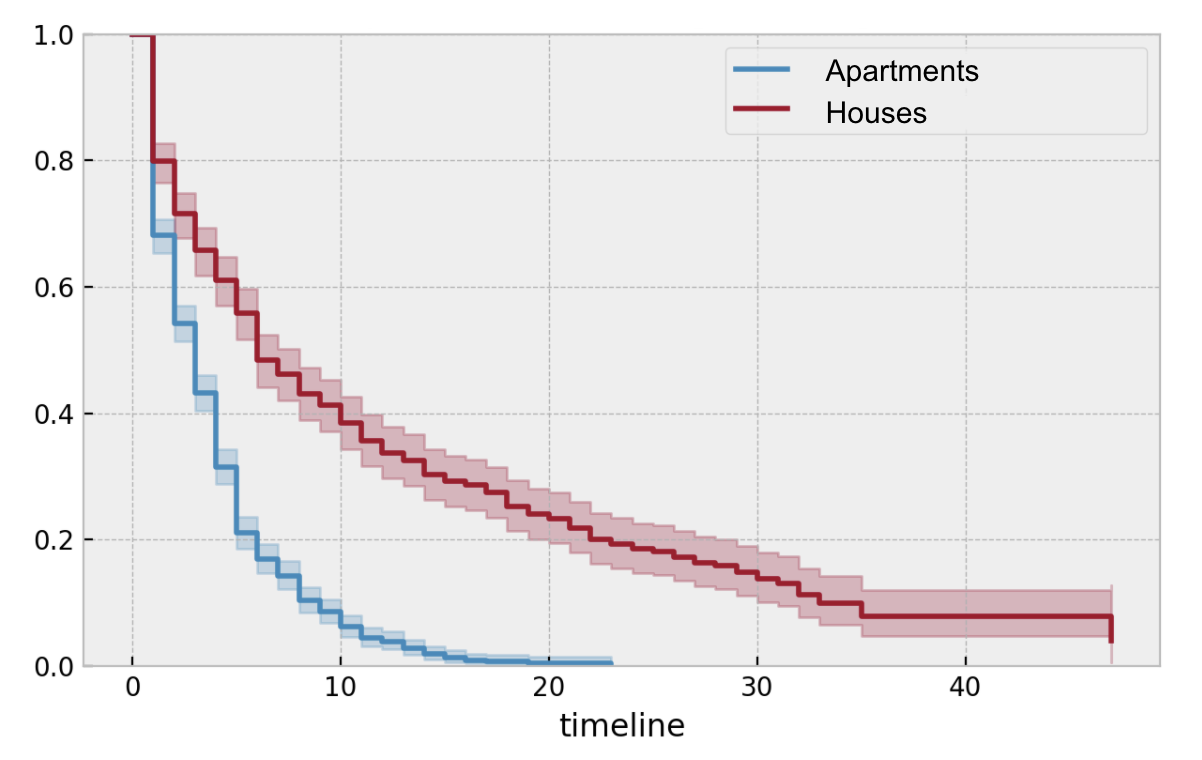
为每个组拟合 Kaplan–Meier 生存函数,并并排可视化其生存曲线。
优点:
为每个组创建布尔掩码。
house = (mortgage_df["property_type"]=="house")
apt = (mortgage_df["property_type"]=="apartment")
若只有 2 个组,只需 1 个掩码;另一组可用取反表示。
创建一个图形并实例化 KaplanMeierFitter。
KaplanMeierFitter
ax = plt.subplot(111)
mortgage_kmf = KaplanMeierFitter()
将 mortgage_kmf 拟合到 house 组,并在图 ax 上绘制。
mortgage_kmf
ax
mortgage_kmf.fit(duration=mortgage_df[house]["duration"],
                 event_observed=mortgage_df[house]["paid_off"],
                 label="Houses")
mortgage_kmf.plot_survival_function(ax=ax)
将 mortgage_kmf 拟合到 apartment 组,并在图 ax 上绘制。
mortgage_kmf.fit(duration=mortgage_df[apt]["duration"],
                 event_observed=mortgage_df[apt]["paid_off"],
                 label="Apartments")
mortgage_kmf.plot_survival_function(ax=ax)
plt.show()
_注意_:若置信区间在某些点重叠,曲线间存在真实差异的可能性更小。