面向 MATLAB 用户的 Python
Justin Kiggins
Product Manager
print(arr)
[[2, 4, 8, 16, 32]]
print(arr[2])
8
print(arr[0])
2
print(arr[-1])
32
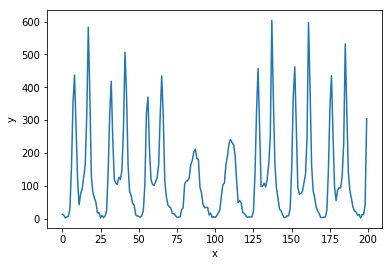
import matplotlib.pyplot as plt
# 创建新图形
plt.figure()

# 绘制 y 关于 x 的曲线
plt.plot(x, y)

# 设置 x/y 轴标签
plt.xlabel('x')
plt.ylabel('y')

# 显示图形
plt.show()
# 创建新图形 plt.figure()
# 绘制 y 关于 x 的曲线 plt.plot(x, y)
# 设置 x/y 轴标签 plt.xlabel('x') plt.ylabel('y')
# 显示图形 plt.show()