R 中的支持向量机
Kailash Awati
Instructor
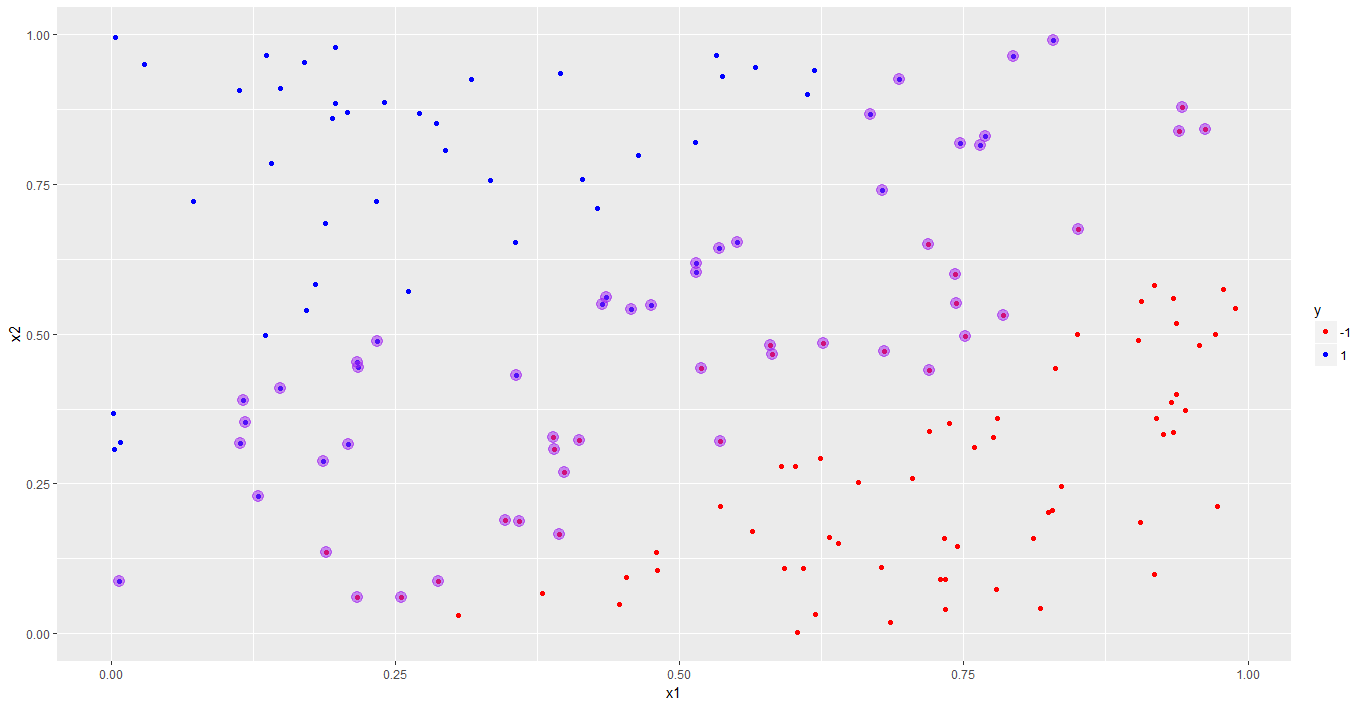
ggplot() 绘制训练数据。# Visualize training data, distinguish classes using color
p <- ggplot(data = trainset, aes(x = x1, y = x2, color = y)) +
geom_point() +
scale_color_manual(values = c("red", "blue"))
# Render plot
p
svm_model 的 index 标出支持向量。# Identify support vectors
df_sv <- trainset[svm_model$index, ]
# Mark out support vectors in plot
p <- p + geom_point(data = df_sv,
aes(x = x1, y = x2),
color = "purple",
size = 4, alpha = 0.5)
# Display plot
p

求边界的斜率与截距:
svm_model 的 coefs 与 SV 构造权重向量 w。# Build weight vector
w <- t(svm_model$coefs) %*% svm_model$SV
-w[1] / w[2]# Calculate slope and save it to a variable
slope_1 <- -w[1] / w[2]
svm_model$rho / w[2]# Calculate intercept and save it to a variable
intercept_1 <- svm_model$rho / w[2]
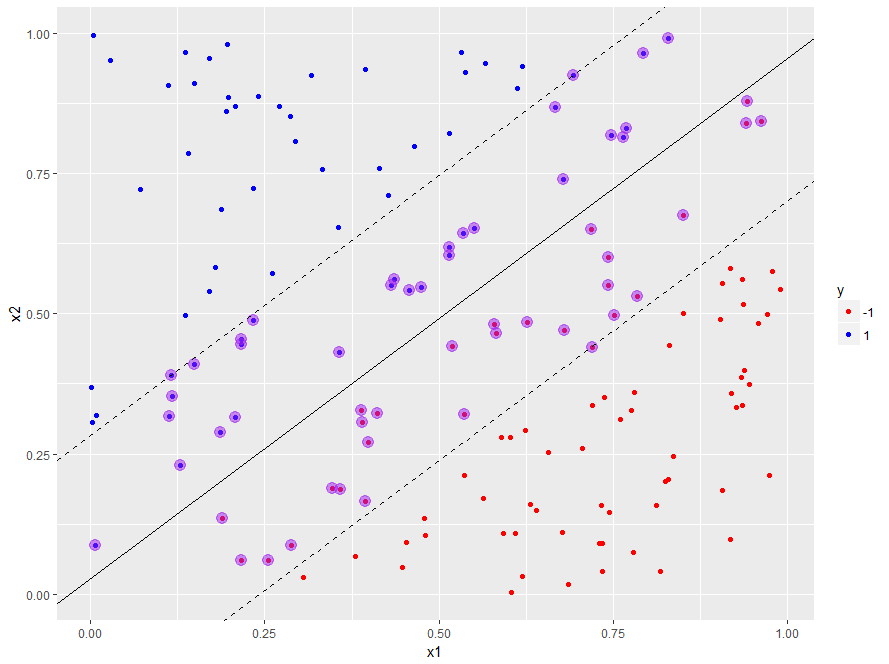
geom_abline() 将决策边界加入图中。# Plot decision boundary based on calculated slope and intercept
p <- p + geom_abline(slope = slope_1,
intercept = intercept_1)
1 / w[2]。# Add margins to plot
p <- p +
geom_abline(slope = slope_1,
intercept = intercept_1 - 1 / w[2],
linetype = "dashed") +
geom_abline(slope = slope_1,
intercept = intercept_1 + 1 / w[2],
linetype = "dashed")
# Display plot
p

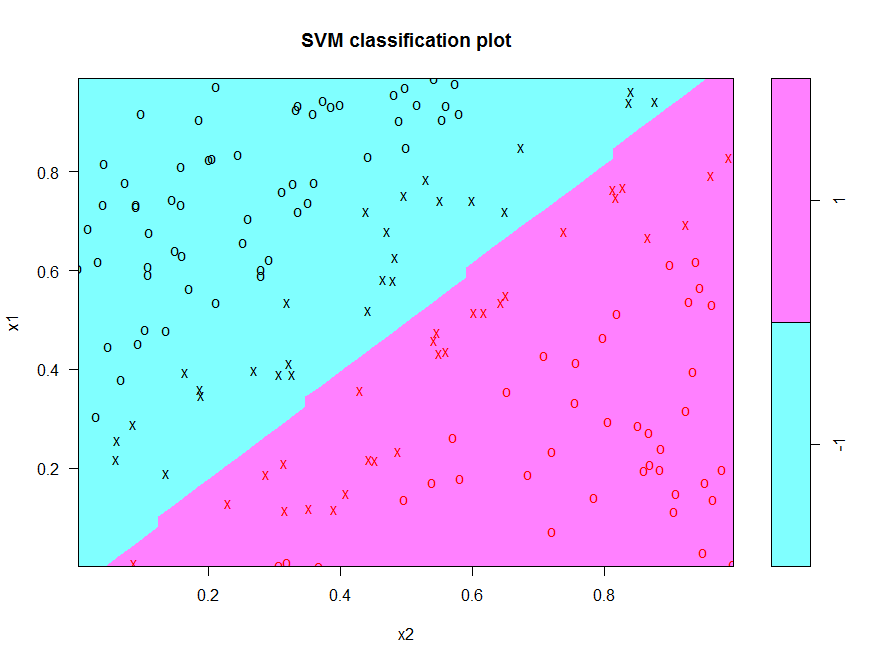
e1071 中的 svm plot() 可轻松绘制决策边界。# Visualize decision boundary using built in plot function
plot(x = svm_model,
data = trainset)

R 中的支持向量机