第一部分:检查数据

用 R 进行股权估值

Cliff Ang

Senior Vice President, Compass Lexecon

检查预测的重要性

  • 垃圾进 → 垃圾出
  • 需要熟悉预测中的所有要素
  • 大多数要素按收入占比或收入变动百分比建模
用 R 进行股权估值

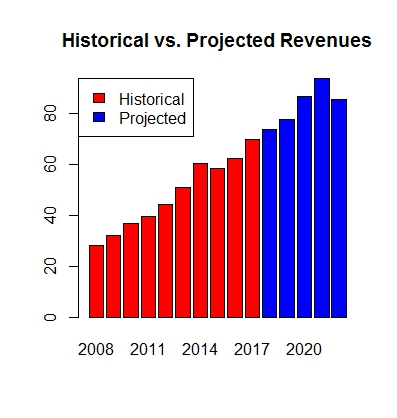
可视化检查数据

# Create two vectors: one for historical (hist) revenues
# and another for projected (proj) revenues
hist <- c(28.4, 32.2, 36.8, 39.8, 44.3, 51.1, 60.4, 
            58.4, 62.5, 69.9, rep(0, 5))
proj <- c(rep(0,10), 73.7, 77.8, 86.8, 93.6, 85.3)

rev_all <- rbind(hist, proj) colnames(rev_all) <- seq(2008, 2022, 1)
# Create bar plot of revenues data barplot(rev_all, col = c("red", "blue"), main = "Historical vs. Projected Revenues")
legend("topleft", legend = c("Historical", "Projected"), fill = c("red", "blue"))
用 R 进行股权估值

柱状图

柱状图

用 R 进行股权估值

使用趋势分析

# Create one vector of historical and projected revenues
rev <- data.frame(c(28.4, 32.2, 36.8, 39.8, 44.3, 51.1, 60.4, 
                      58.4, 62.5, 69.9, 73.7, 77.8, 86.8, 93.6, 85.3))
rownames(rev) <- seq(2008, 2022, 1)
names(rev) <- "rev"

# Add trend and shift variables rev$trend <- seq(1, 15, 1)
rev$shift <- c(rep(0, 10), rep(1, 5))
用 R 进行股权估值
reg <- lm(rev ~ trend + shift, data = rev)
summary(reg)
# Call:
# lm(formula = rev ~ trend + shift, data = rev)
# 
# Residuals:
#     Min      1Q  Median      3Q     Max 
# -7.2232 -1.5508 -0.2843  0.7700  5.6184 
# 
# Coefficients:
#             Estimate Std. Error t value Pr(>|t|)    
# (Intercept)  23.4011     2.2066   10.61 1.89e-07 ***
# trend         4.5416     0.3511   12.94 2.09e-08 ***
# shift         0.9978     3.2179    0.31    0.762    
# ---
# Signif. codes:  0 '***' 0.001 '**' 0.01 '*' 0.05 '.' 0.1 ' ' 1
# 
# Residual standard error: 3.377 on 12 degrees of freedom
# Multiple R-squared:  0.9777,    Adjusted R-squared:  0.974 
# F-statistic: 263.3 on 2 and 12 DF,  p-value: 1.222e-10
用 R 进行股权估值

Ayo berlatih!

用 R 进行股权估值

Preparing Video For Download...