使用 R 中的 Trelliscope 可视化大数据
Ryan Hafen
Author, TrelliscopeJS
传入 ggplot() 的所有变量都会被检查,以用作认知统计。
gap <- gapminder %>% group_by(country) %>% mutate(latestLifeExp = tail(lifeExp, 1))gap
# A tibble: 1,704 x 7
# Groups: country [142]
country continent year lifeExp pop gdpPercap latestLifeExp
<fct> <fct> <int> <dbl> <int> <dbl> <dbl>
1 Afghanistan Asia 1952 28.8 8425333 779 43.8
2 Afghanistan Asia 1957 30.3 9240934 821 43.8
3 Afghanistan Asia 1962 32.0 10267083 853 43.8
4 Afghanistan Asia 1967 34.0 11537966 836 43.8
5 Afghanistan Asia 1972 36.1 13079460 740 43.8
6 Afghanistan Asia 1977 38.4 14880372 786 43.8
# ... with 1,698 more rows
gap <- gapminder %>%
group_by(country, continent) %>%
mutate(wiki = paste0("https://en.wikipedia.org/wiki/", country))
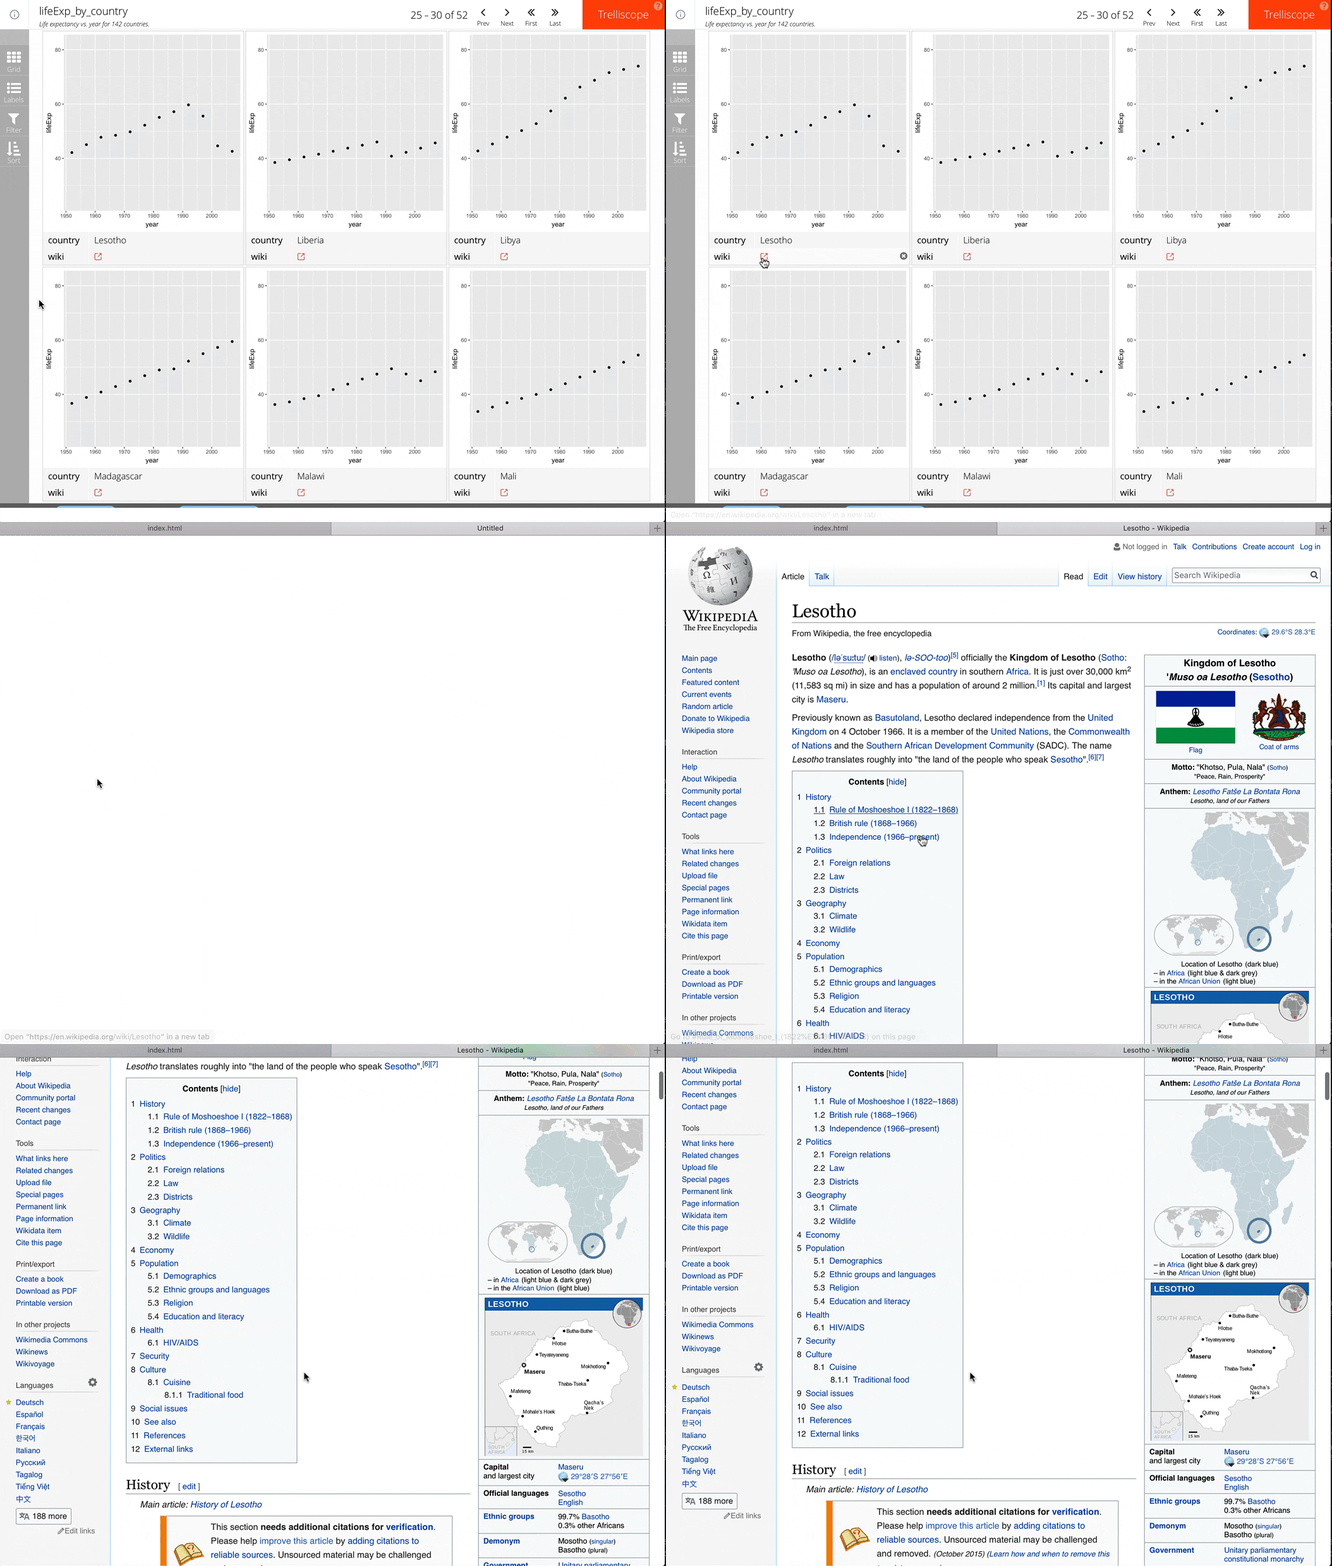
可以用 cog() 包装变量,以微调 Trelliscope 中认知统计的处理方式。
使用 cog() 时,常用的设置包括:
desc:该认知统计的简要描述default_label:布尔值,指示是否默认显示为标签gap$wiki <- cog_href(gap$wiki,
desc = "Link to wikipedia",
default_label = TRUE)
使用 R 中的 Trelliscope 可视化大数据