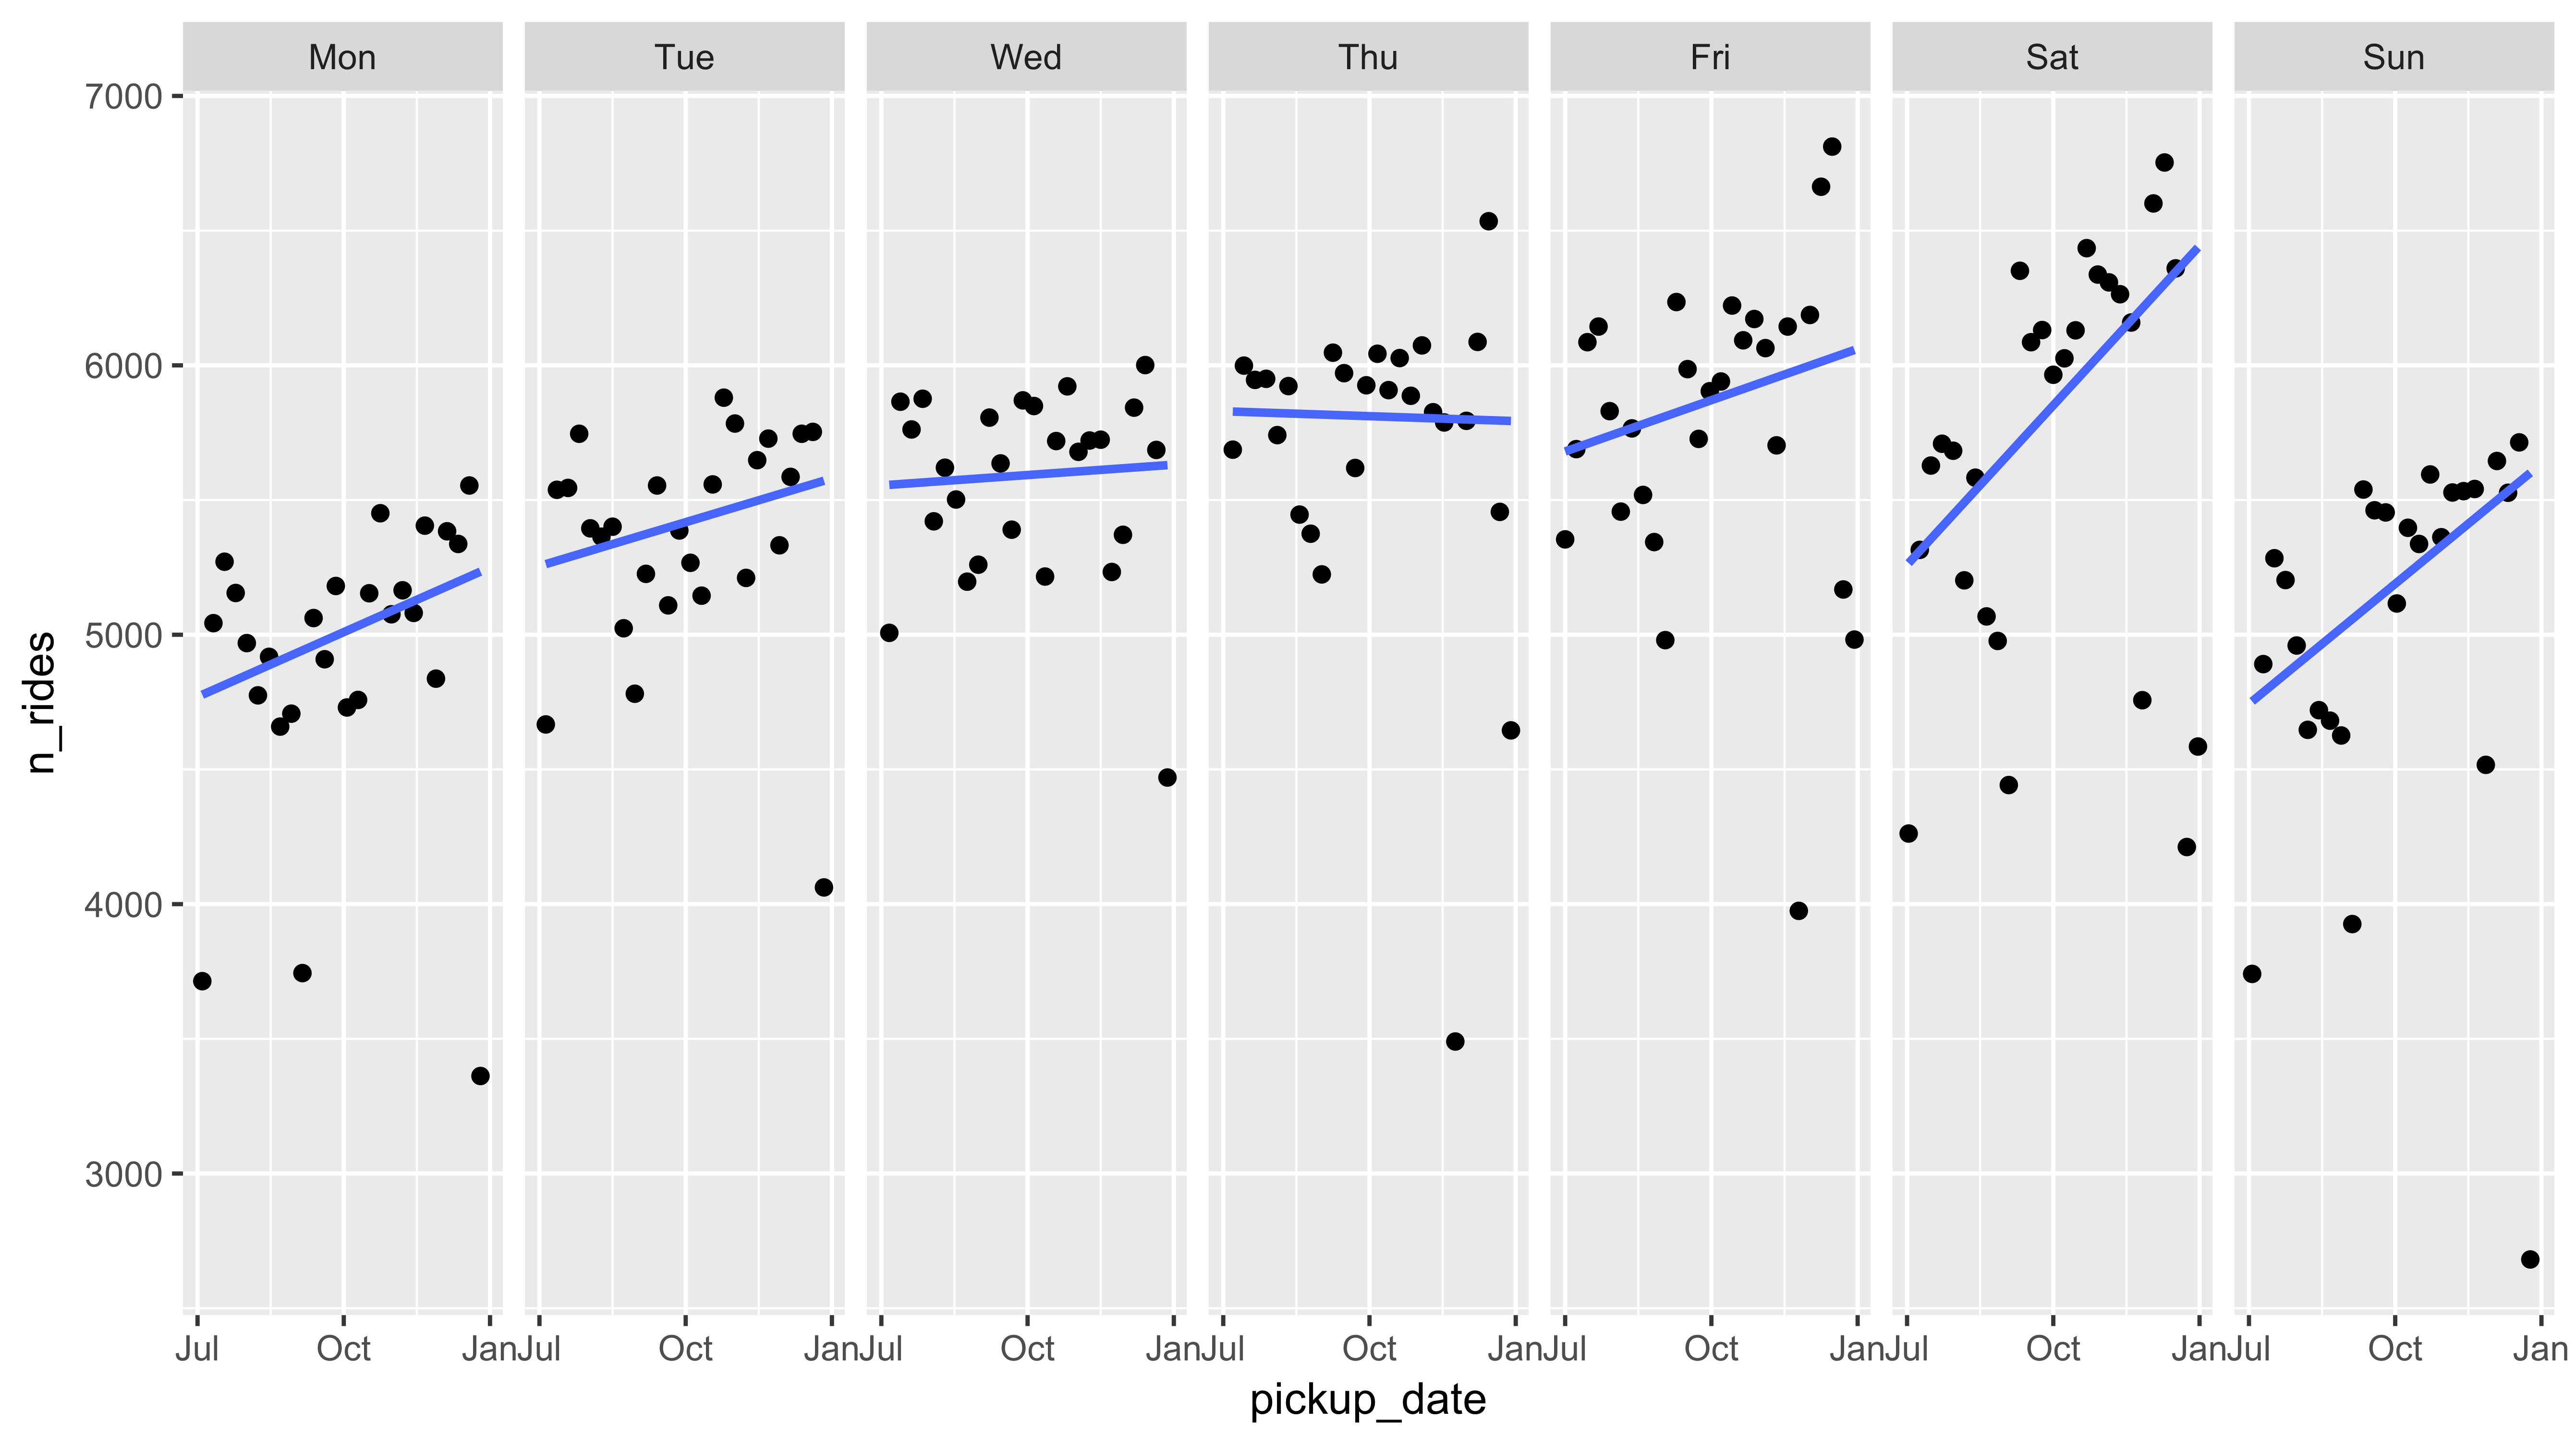
为汇总添加更多细节
使用 R 中的 Trelliscope 可视化大数据

Ryan Hafen
Author, TrelliscopeJS
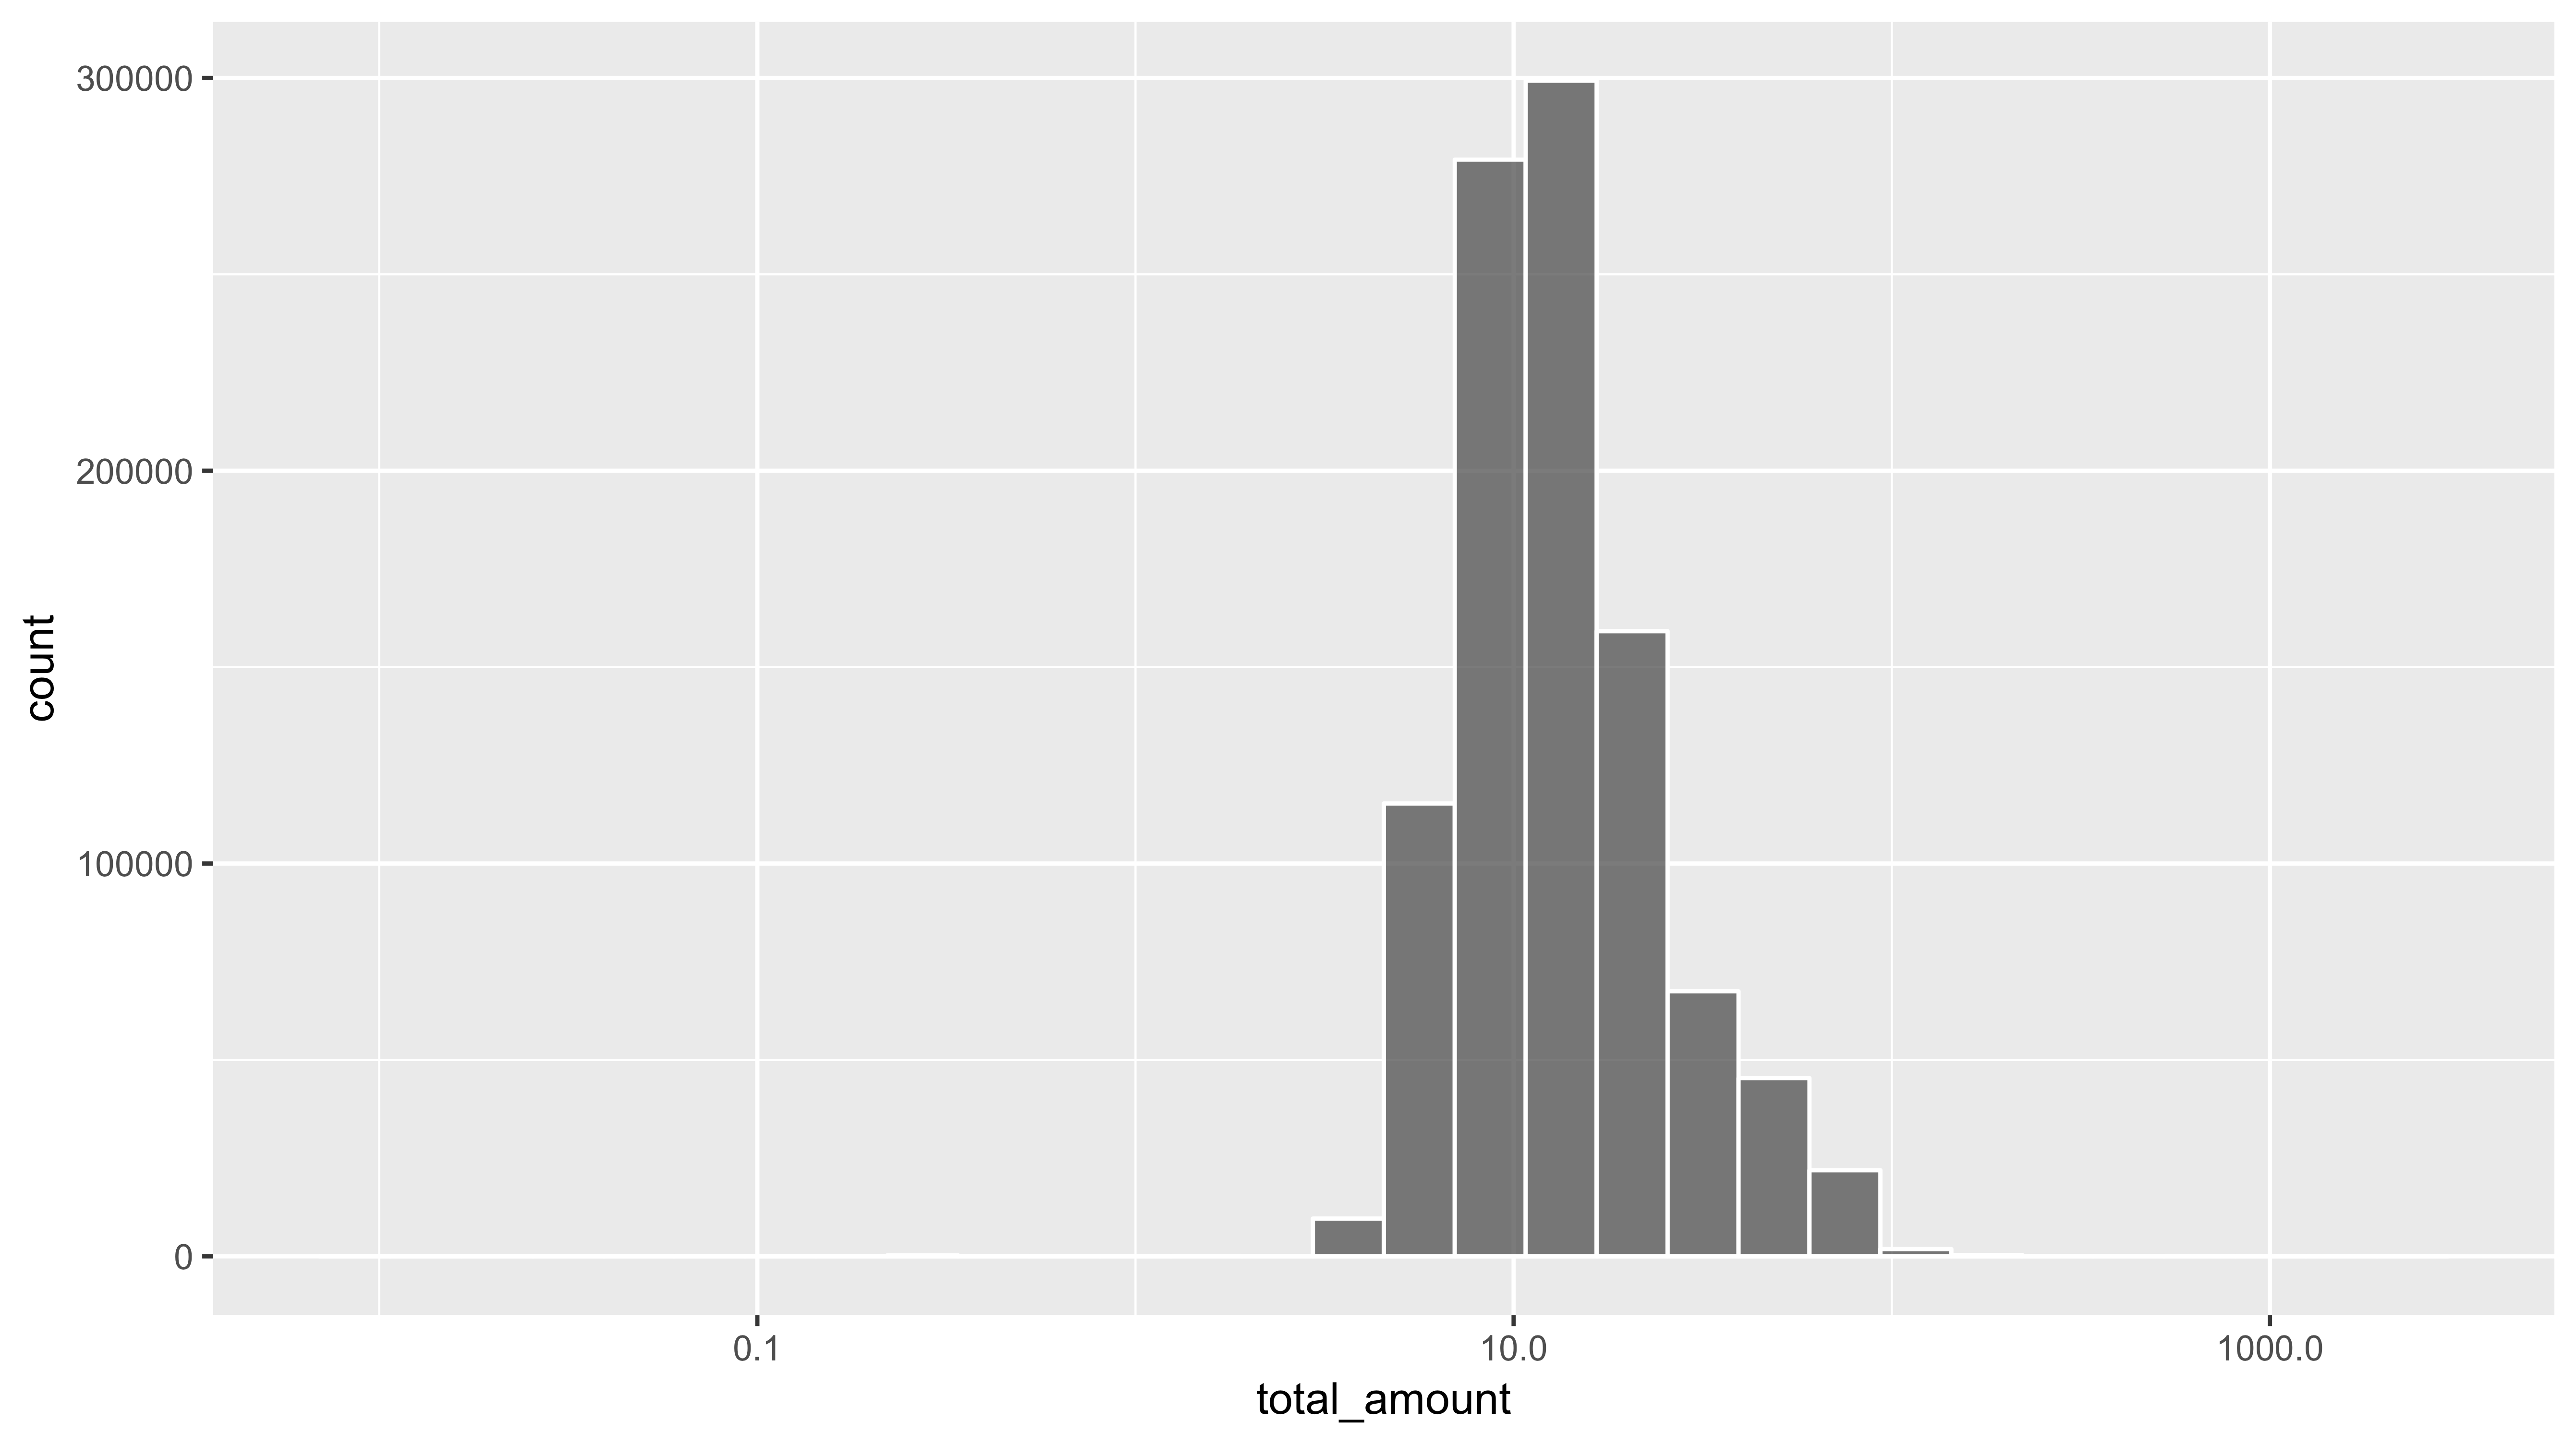
总车费分布
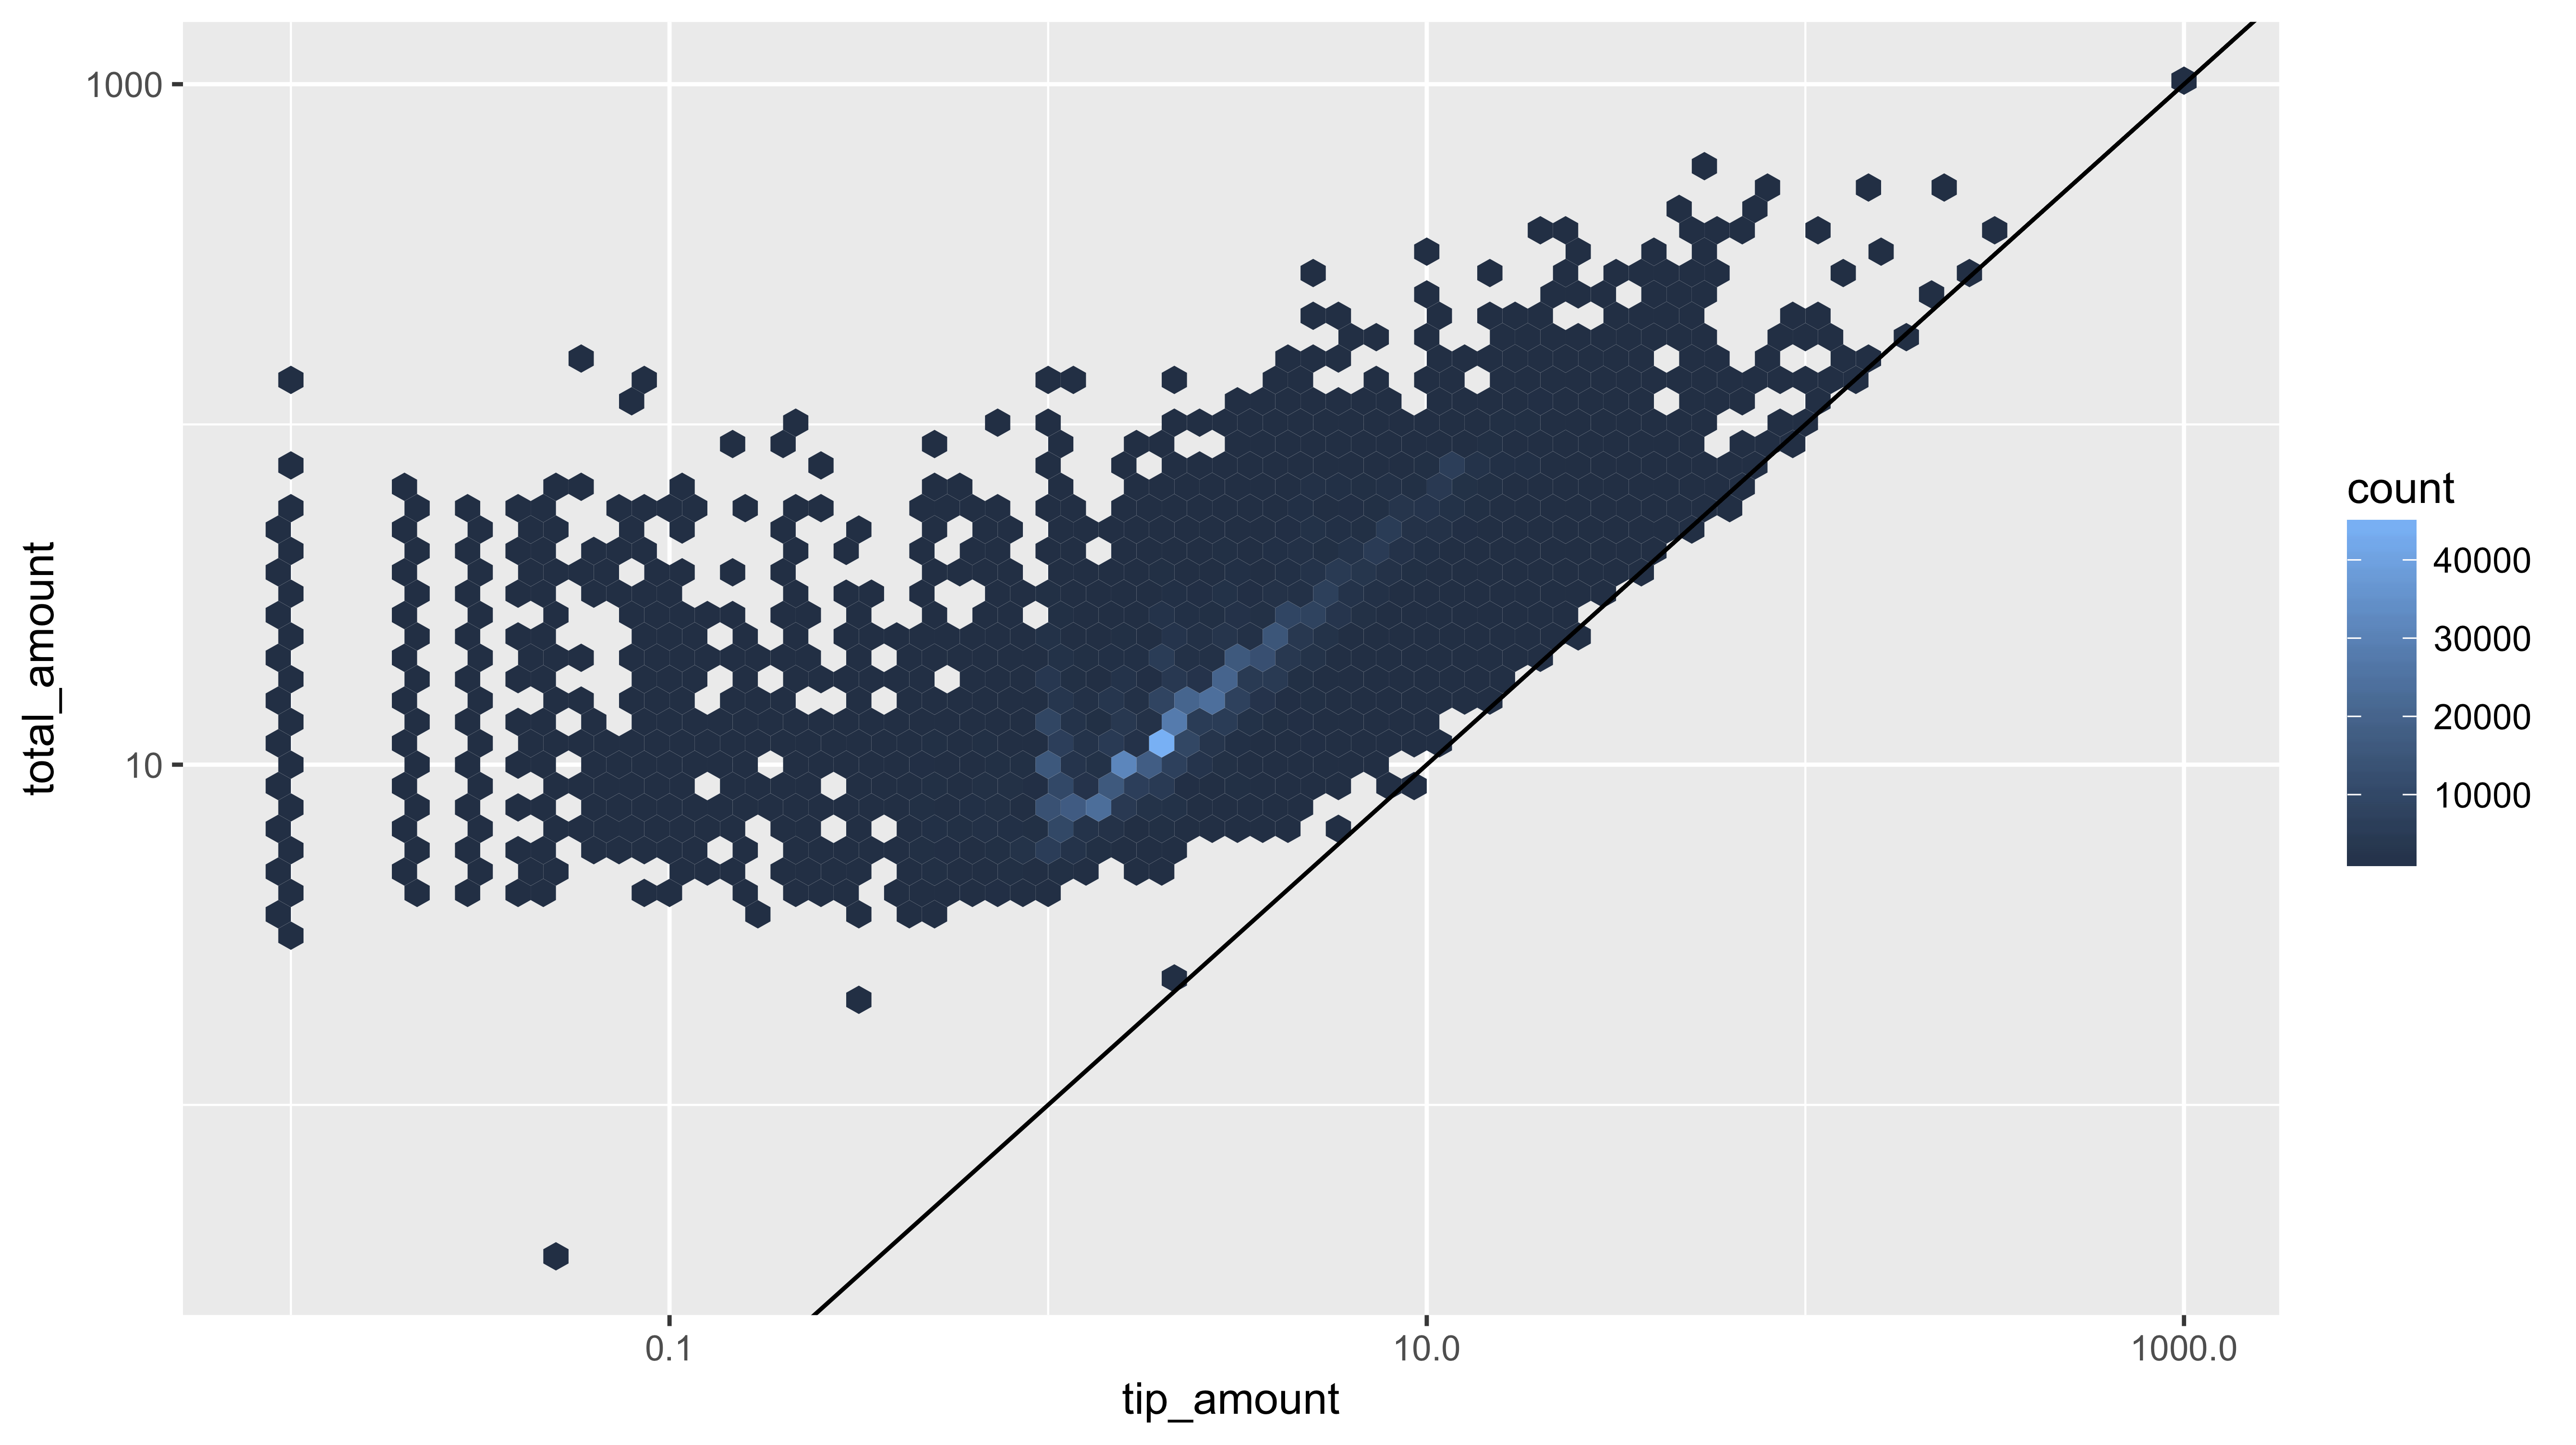
使用 geom_hex() 对连续变量分箱
ggplot(tx, aes(tip_amount, total_amount)) +geom_hex(bins = 75) + scale_x_log10() + scale_y_log10() + geom_abline(slope = 1, intercept = 0)
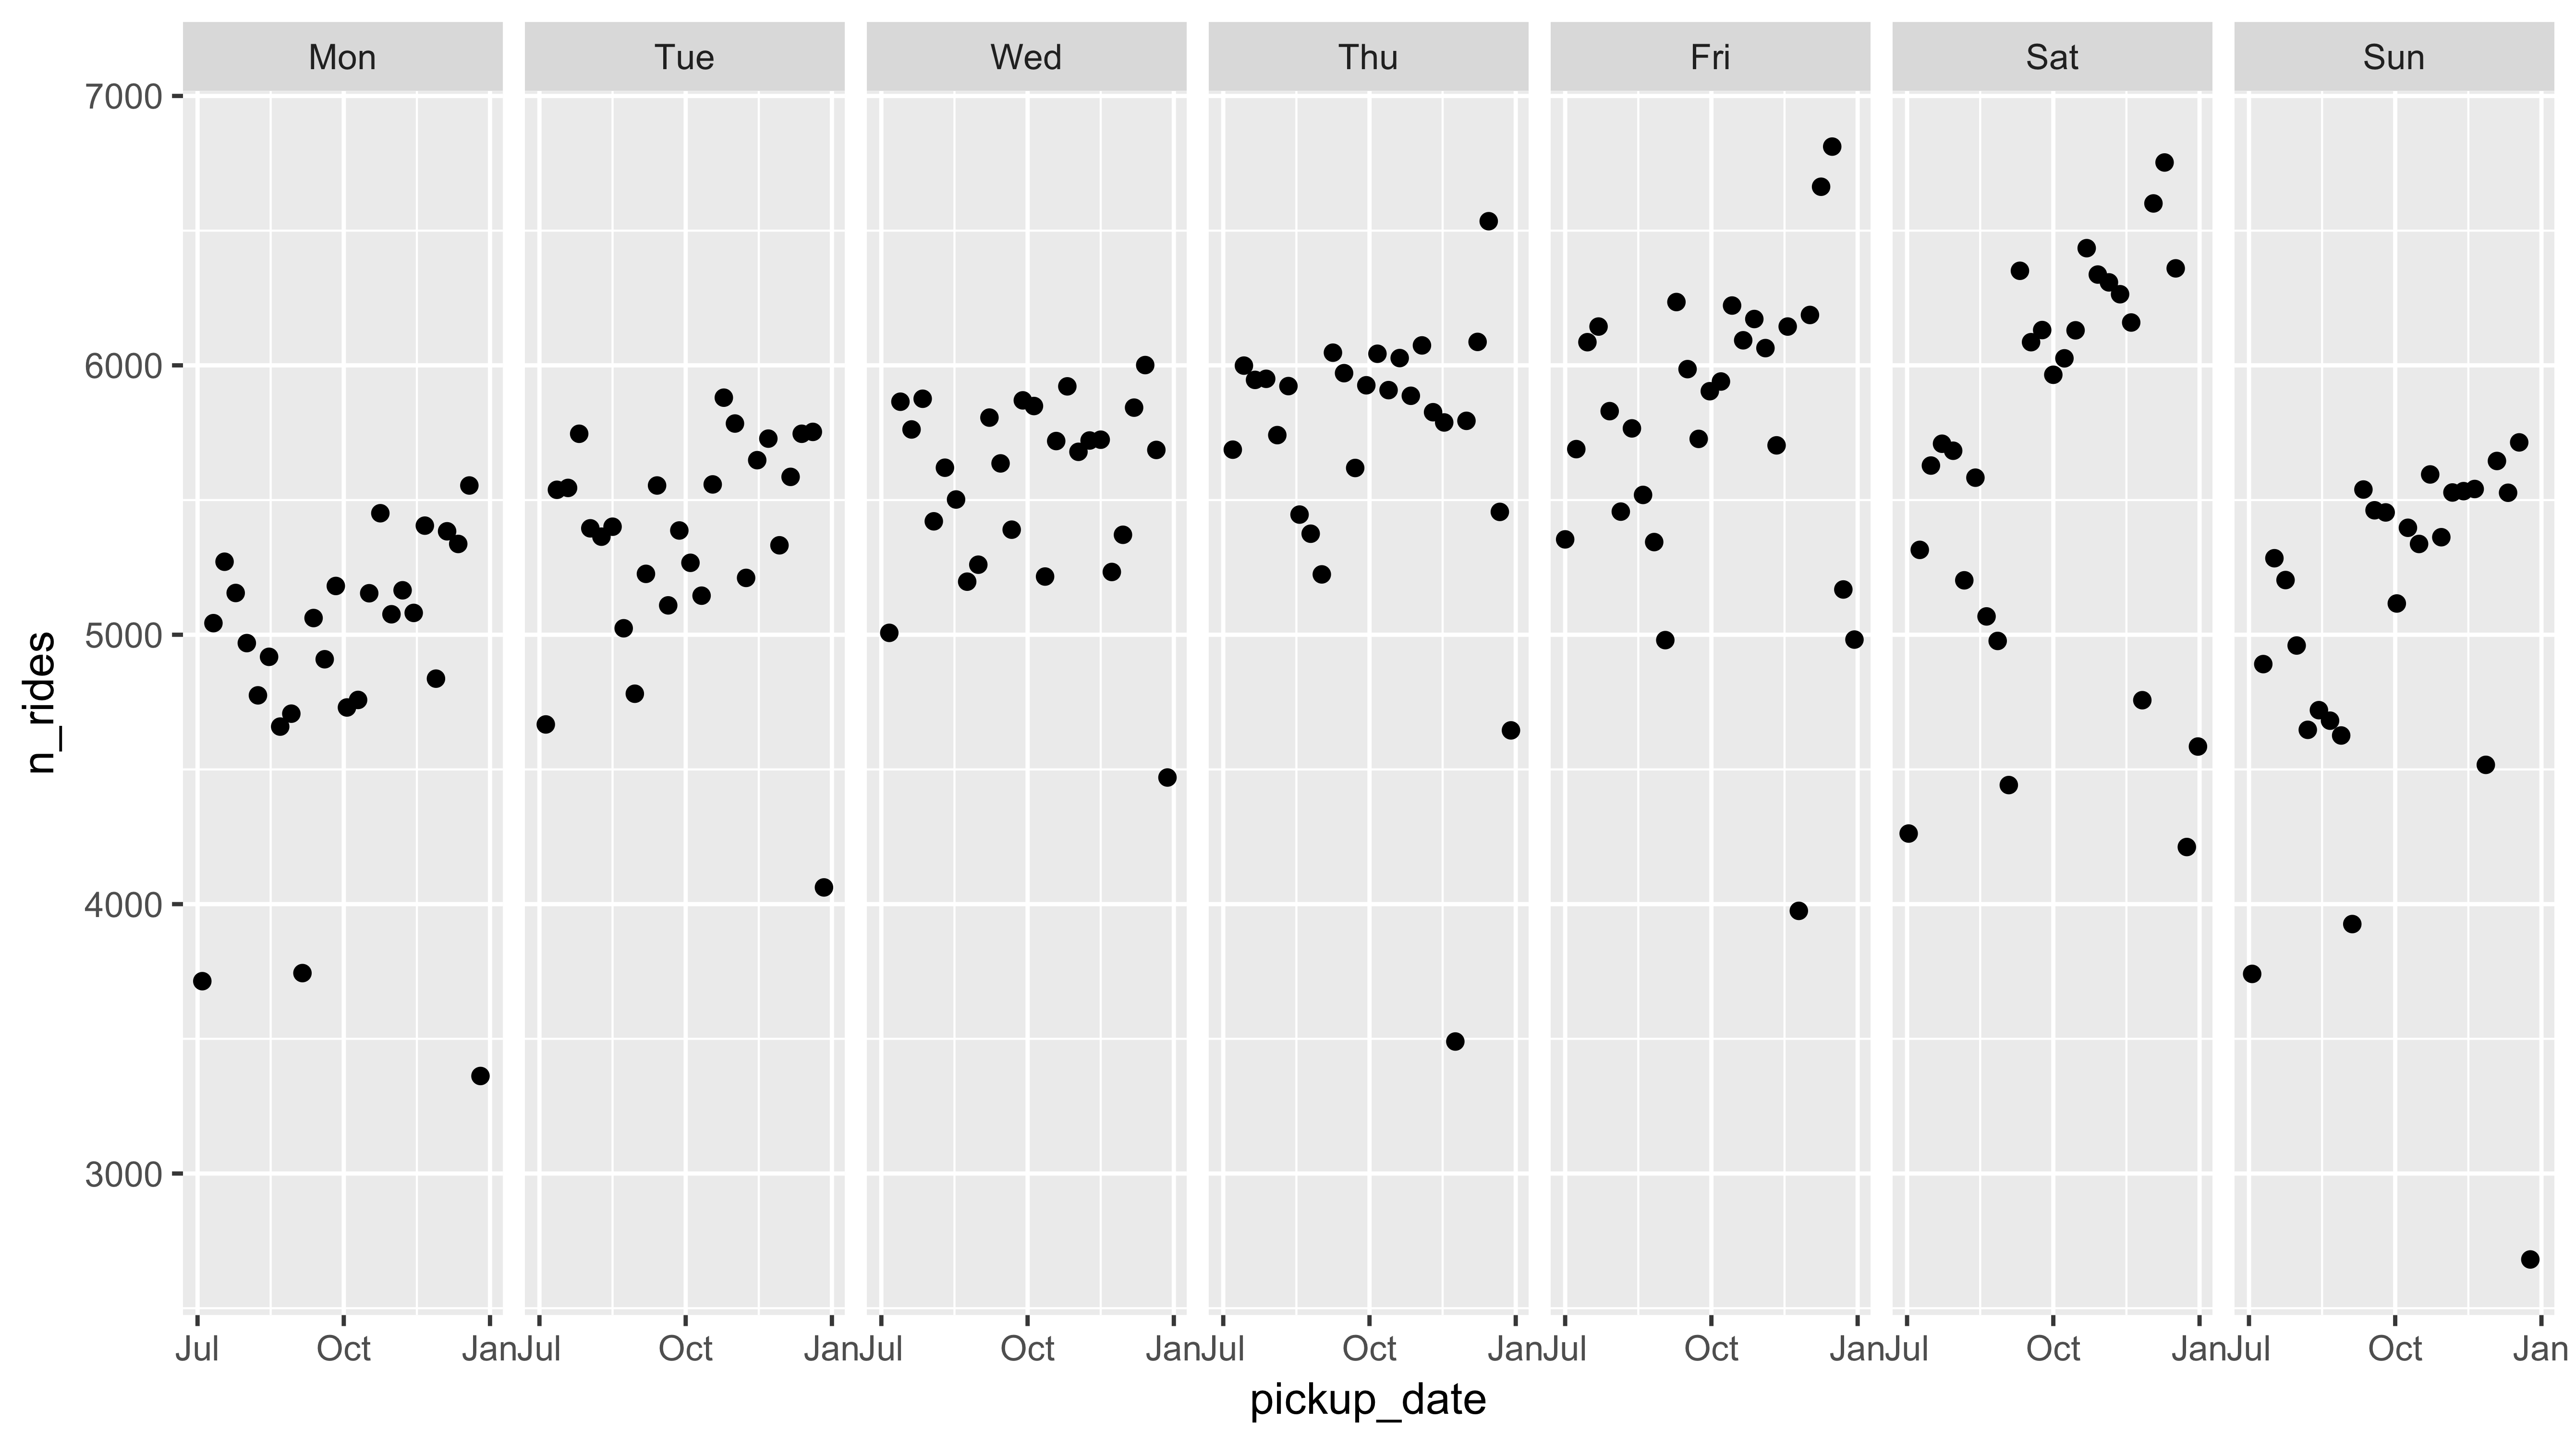
使用 facet_wrap() 分面
ggplot(daily_count, aes(pickup_date, n_rides)) +
  geom_point() +
  facet_wrap(~ pickup_dow)
分面
ggplot(daily_count, aes(pickup_date, n_rides)) +
  geom_point() +
  facet_grid(~ pickup_dow) +
  geom_smooth(method = "rlm", se = FALSE)