使用 R 中的 Trelliscope 可视化大数据
Ryan Hafen
Author, TrelliscopeJS
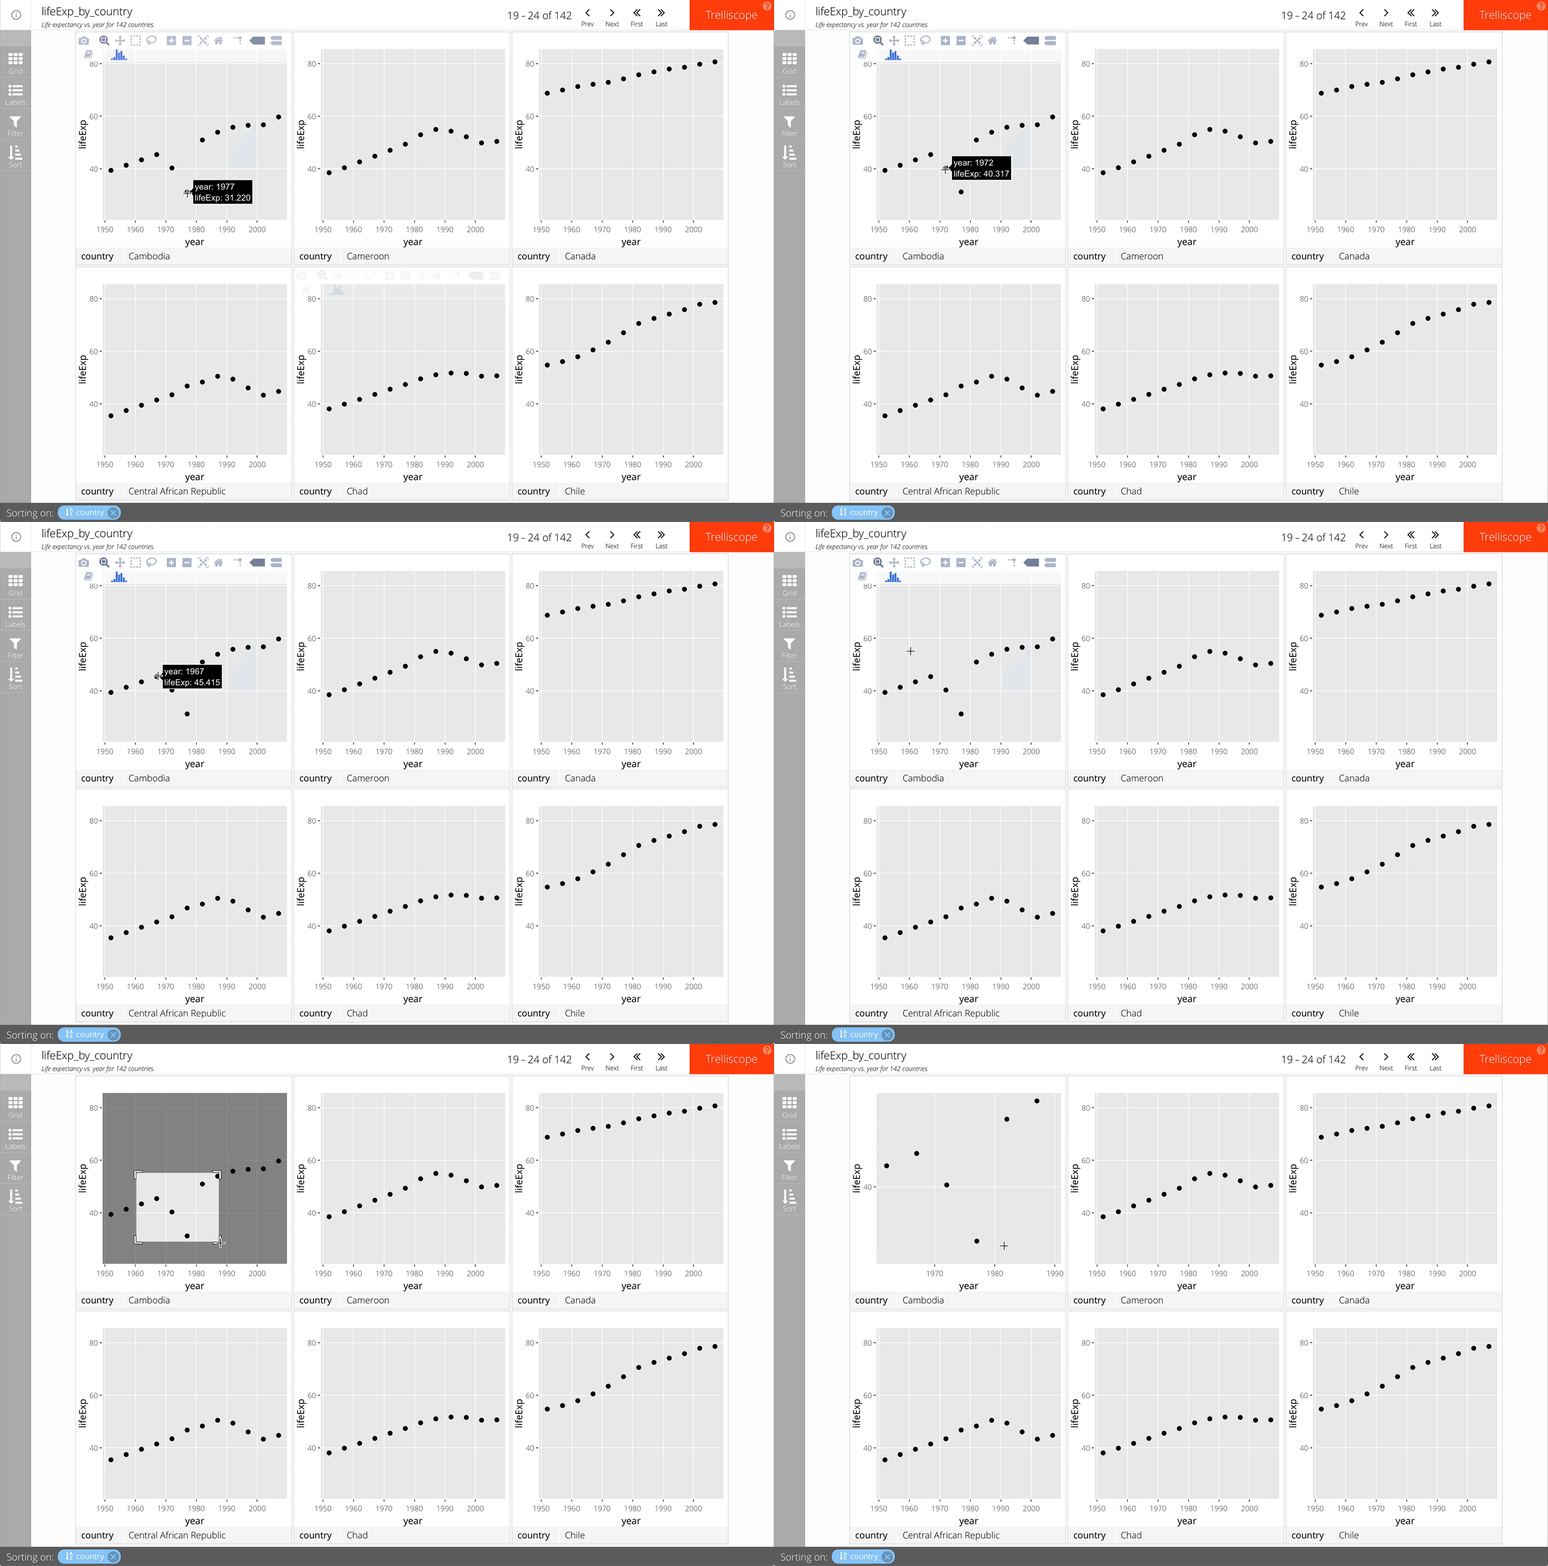
只需在 facet_trelliscope() 中添加 as_plotly = TRUE。
例如:
gap_life <- select(gapminder, year, lifeExp, country, continent)
ggplot(gap_life, aes(year, lifeExp)) +
geom_point() +
facet_trelliscope(~ country + continent,
name = "lifeExp_by_country",
desc = "Life expectancy vs. year for 142 countries.",
nrow = 2, ncol = 3,
as_plotly = TRUE)

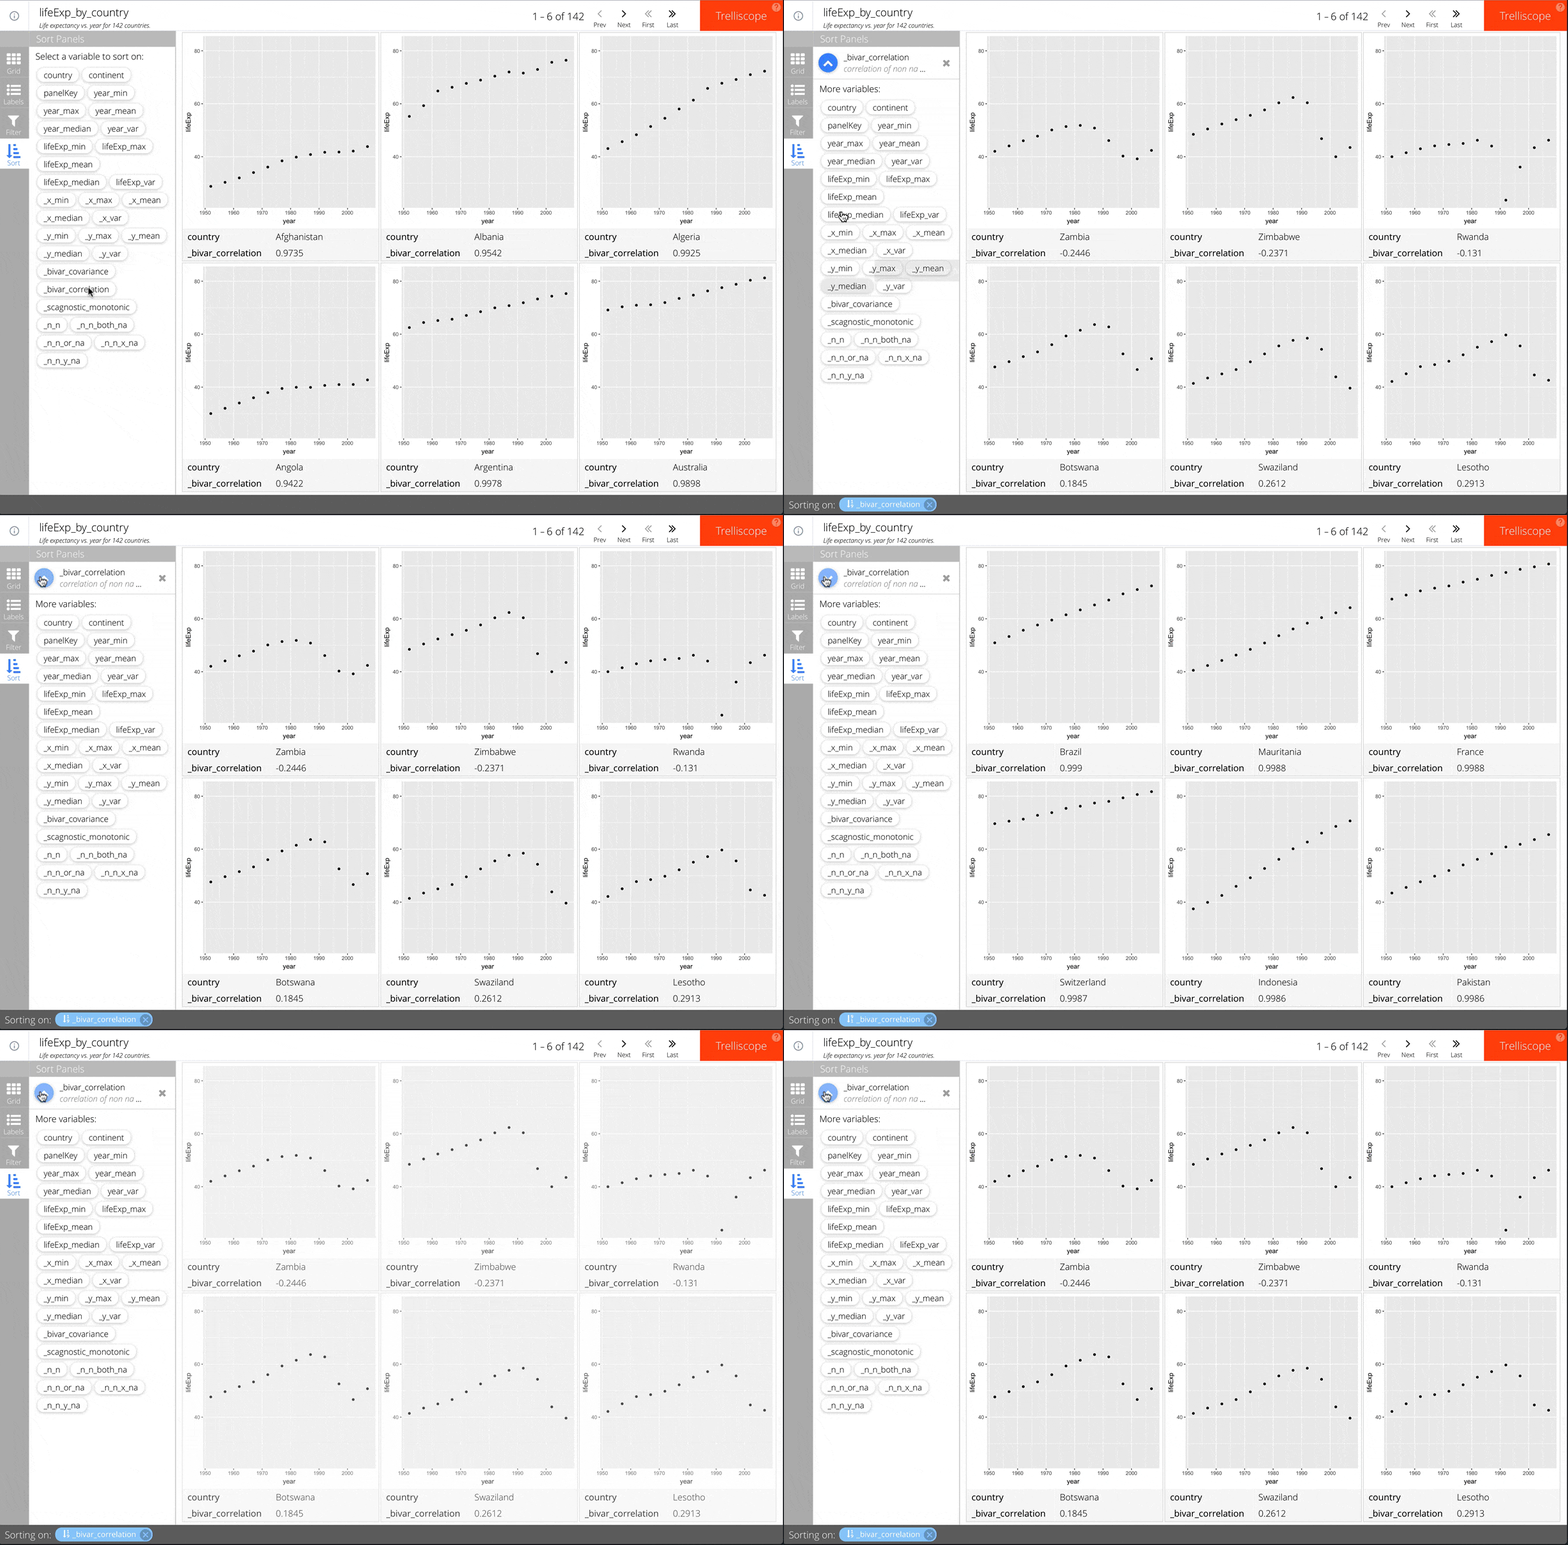
只需在 facet_trelliscope() 中添加 auto_cog = TRUE。
例如:
ggplot(gap_life, aes(year, lifeExp)) +
geom_point() +
facet_trelliscope(~ country + continent,
name = "lifeExp_by_country",
desc = "Life expectancy vs. year for 142 countries.",
nrow = 2, ncol = 3,
auto_cog = TRUE)
更多可用的自动认知量请参阅 autocogs::autocog 帮助。

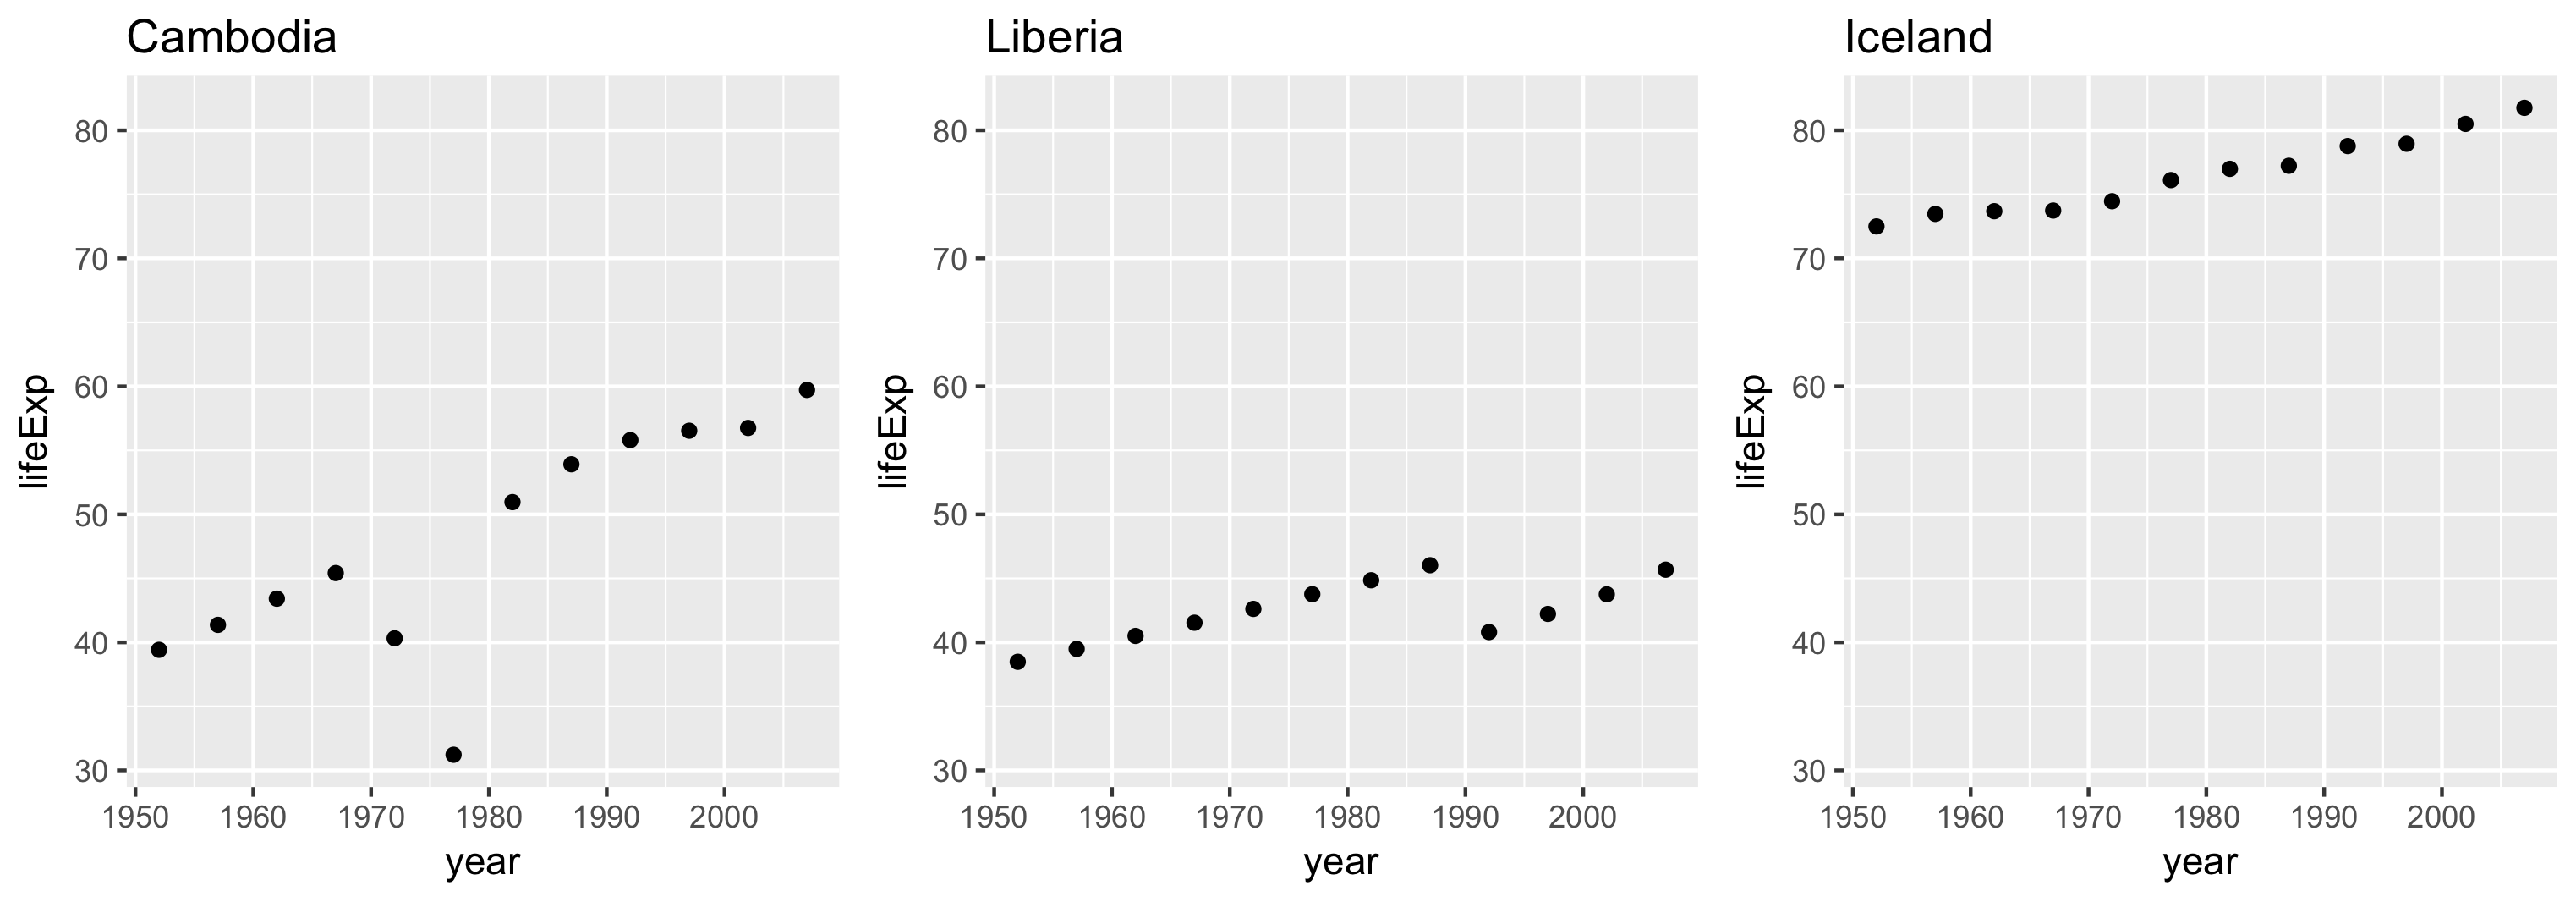
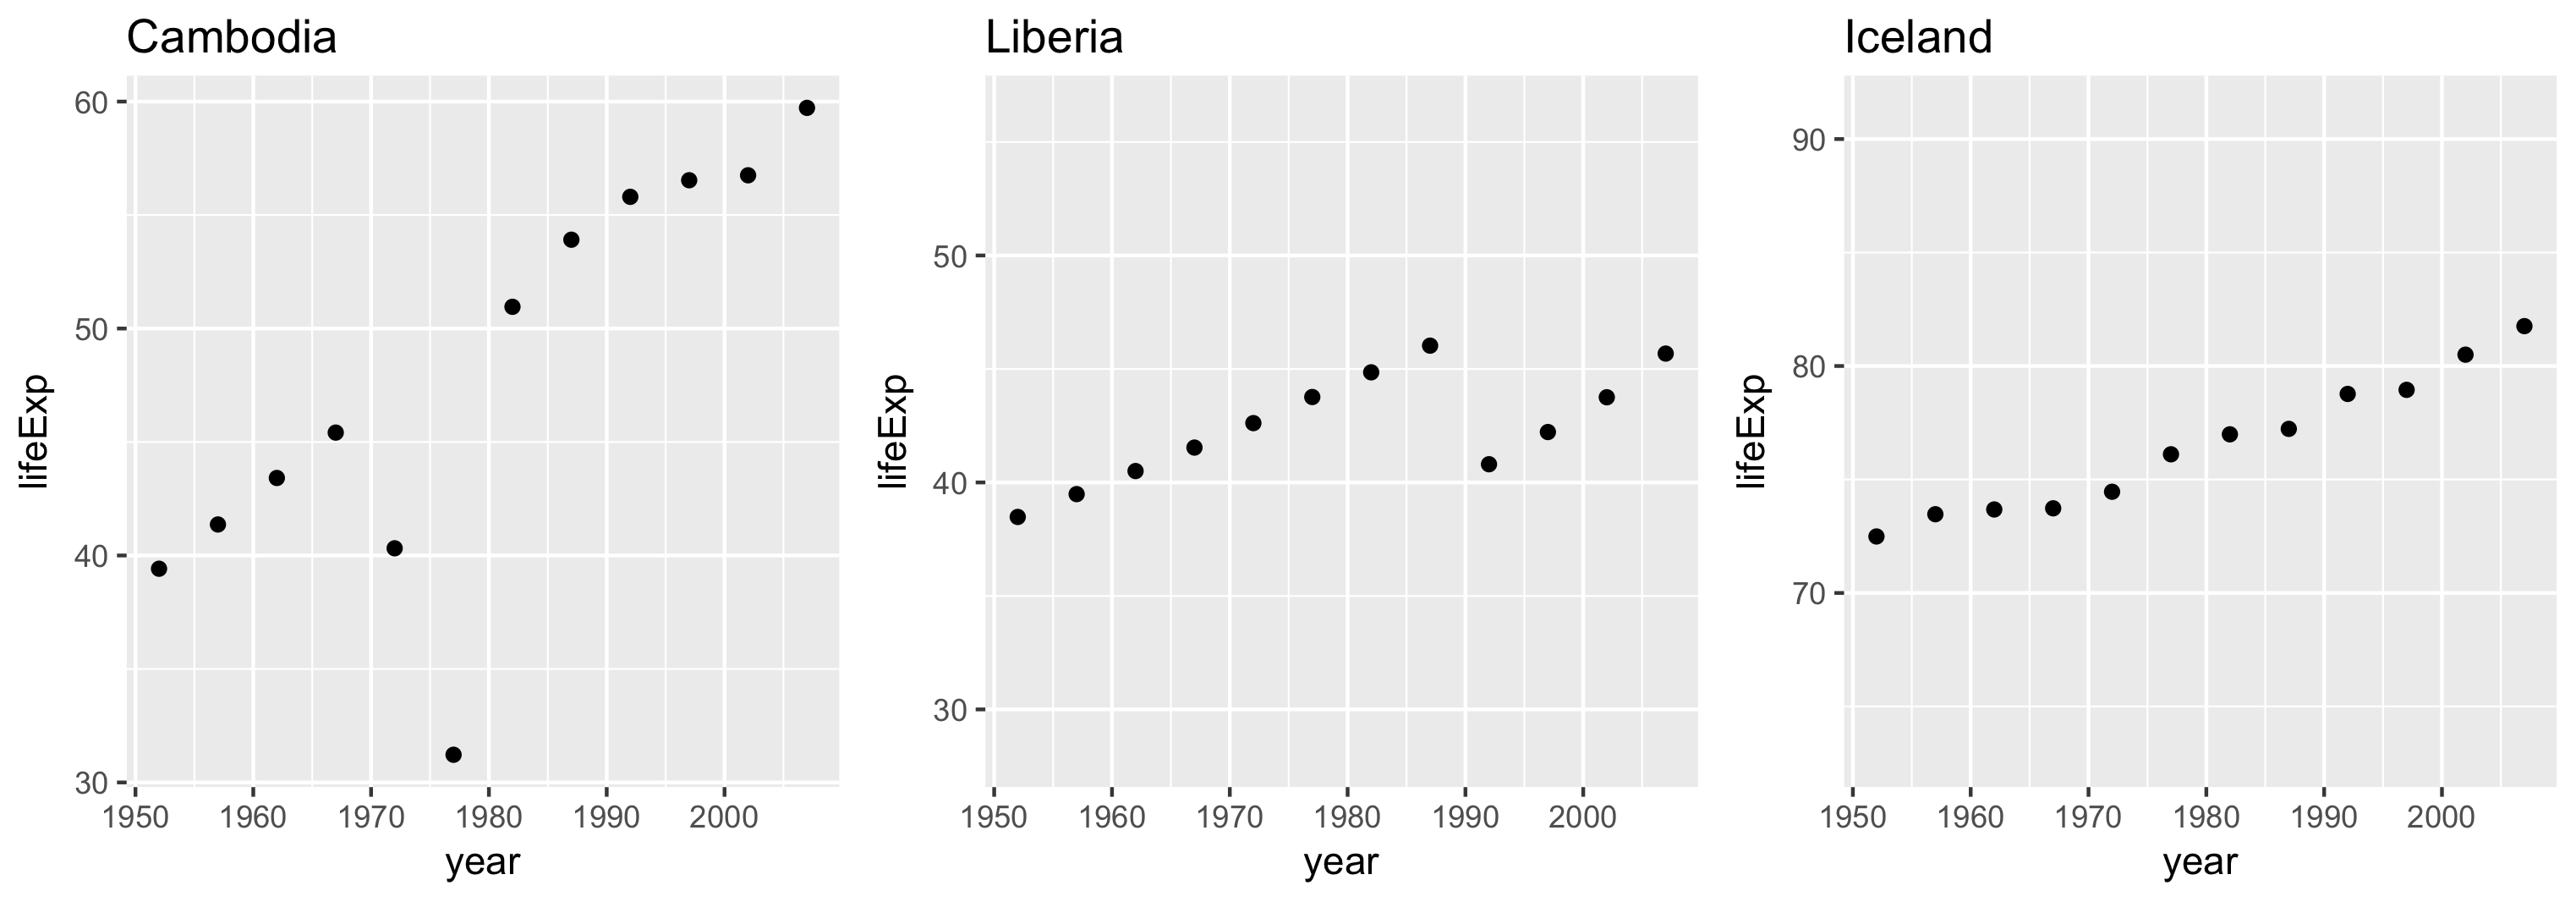
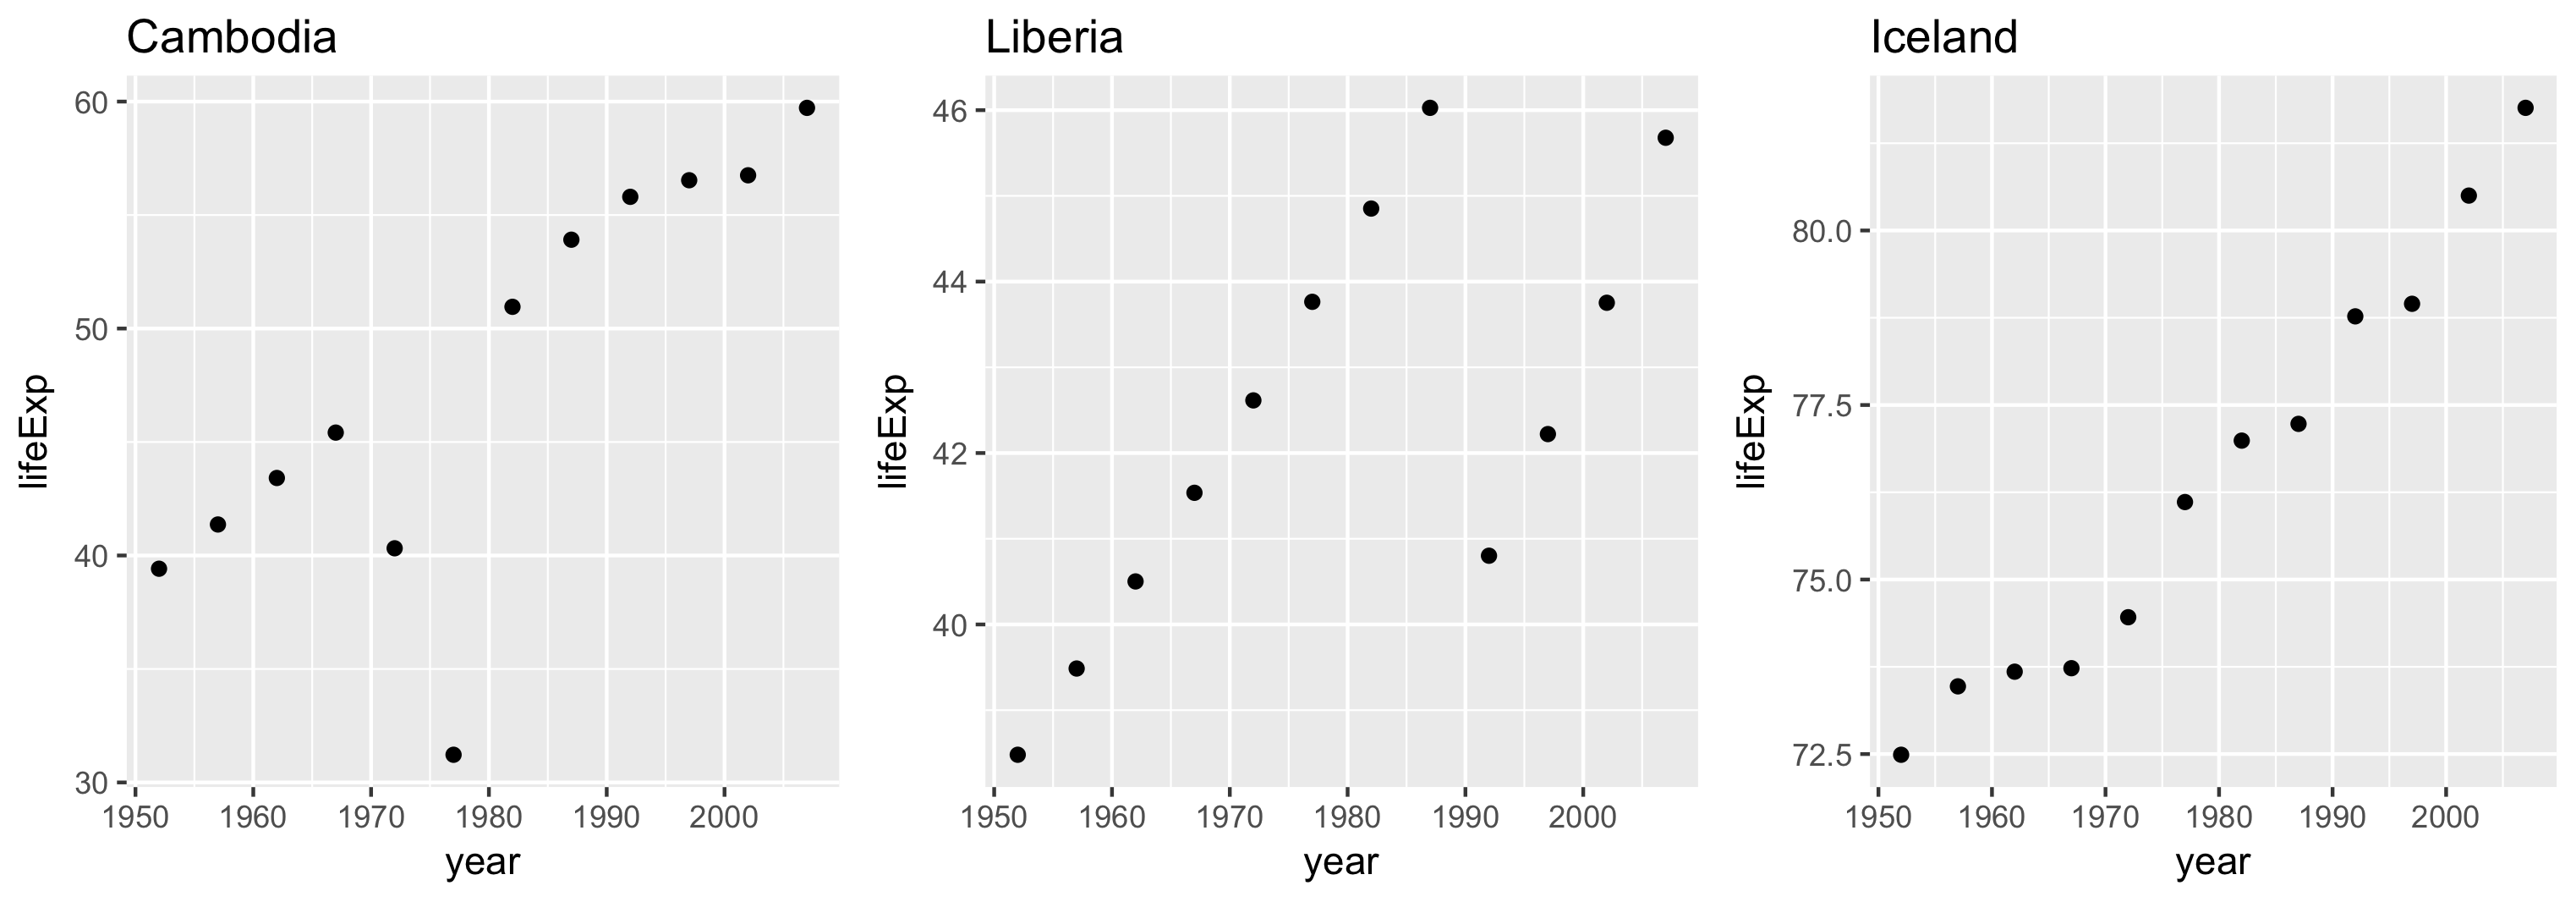
可用 scales 参数控制坐标轴范围。
三种选项:
"same"(默认)"sliced""free"每个面板的坐标范围相同。
便于进行"同类"比较。

每个面板的范围跨度一致,但起点不一定相同。
便于比较尺度差异。

每个面板的范围基于其自身数据的边界。

使用 R 中的 Trelliscope 可视化大数据