Trelliscope 选项

使用 R 中的 Trelliscope 可视化大数据

Ryan Hafen

Author, TrelliscopeJS

Trelliscope 选项

facet_trelliscope()trelliscope() 提供多种显示设置:

  • 存放显示的目录
  • 在同一目录中存放多个显示
  • 更详细的显示描述
  • 图形纵横比
  • 默认查看器状态
使用 R 中的 Trelliscope 可视化大数据

指定输出目录

trelliscope(dat, path = "...", ...)

ggplot(...) + ... + facet_trelliscope(path = "...", ...)

使用 R 中的 Trelliscope 可视化大数据
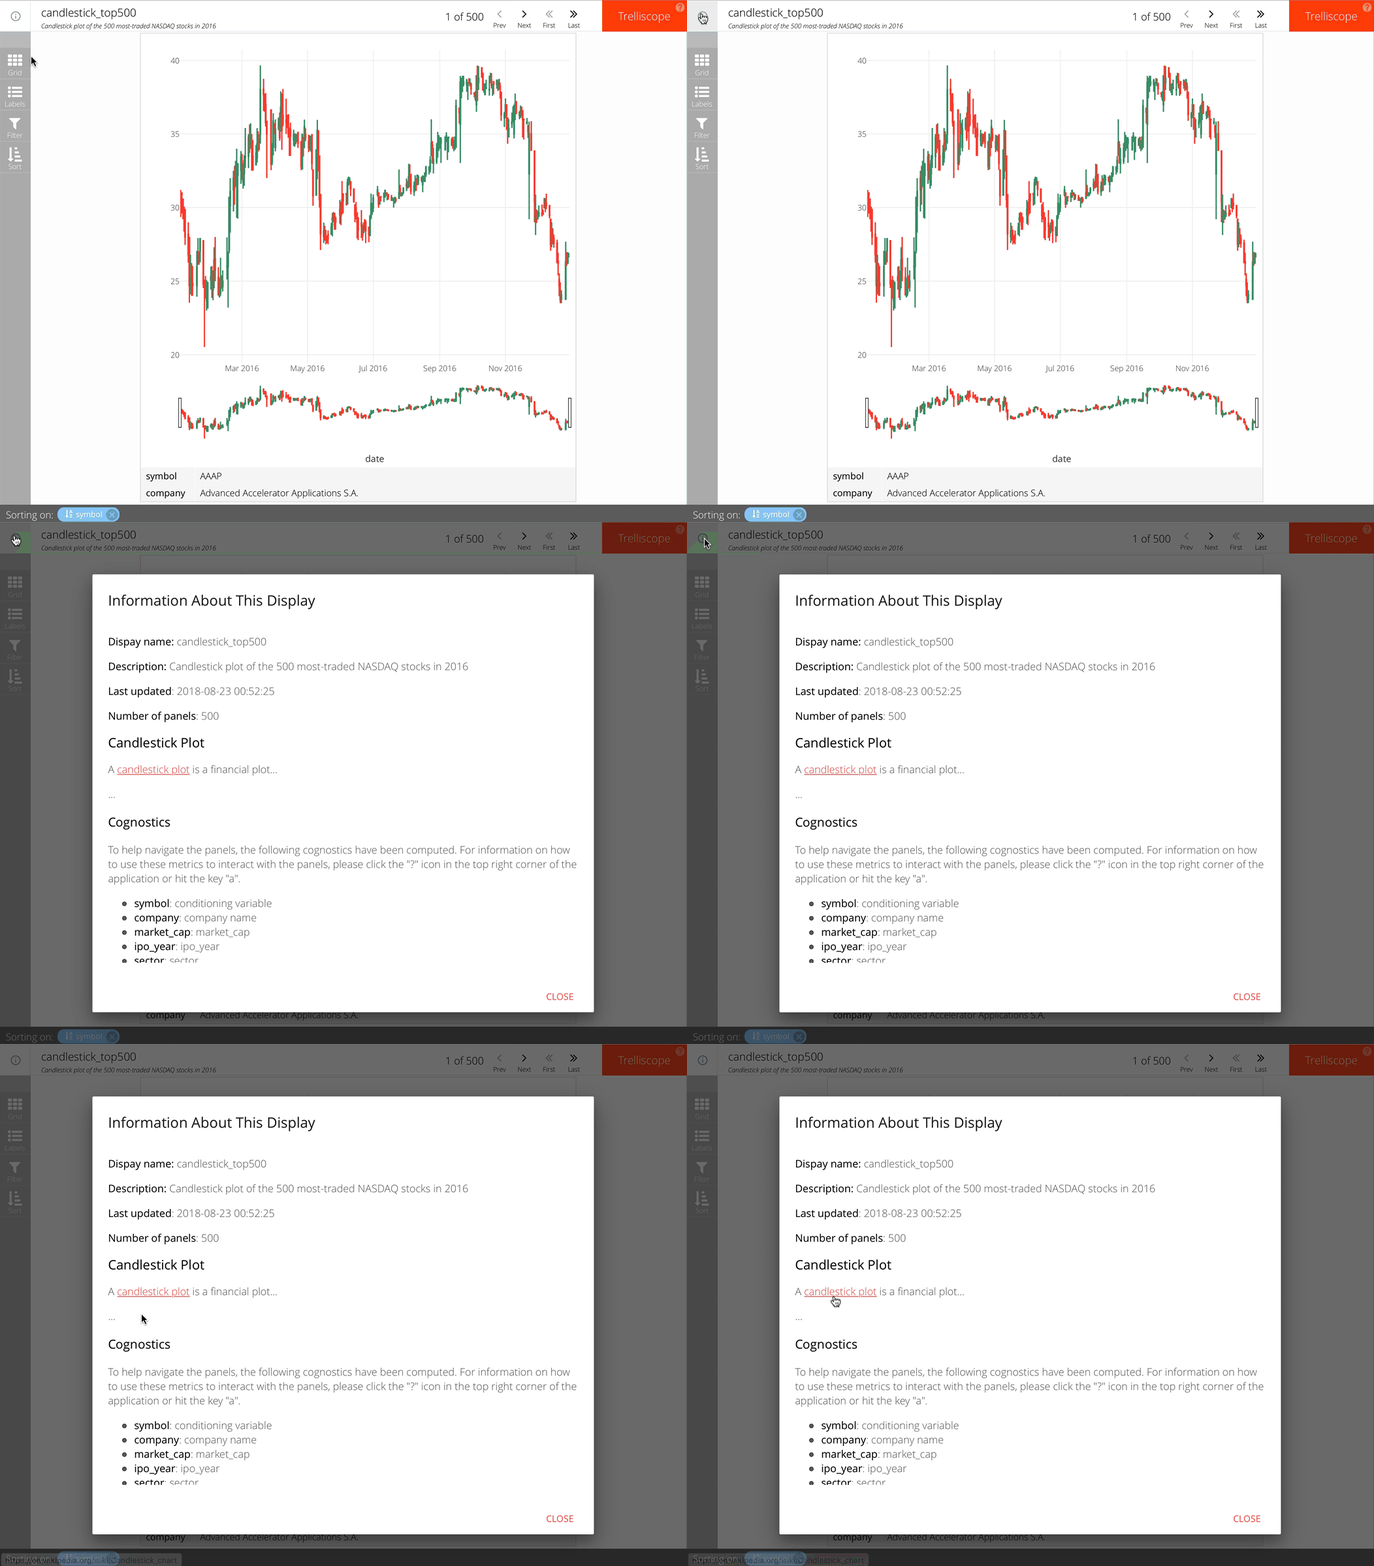
trelliscope(by_symbol,
  name = "candlestick_top500",
  desc = "Candlestick plot of the 500 most-traded NASDAQ stocks in 2016",
  md_desc = "
## Candlestick Plot
A [candlestick plot](https://en.wikipedia.org/wiki/Candlestick_chart)
is a financial plot...
..." )
使用 R 中的 Trelliscope 可视化大数据

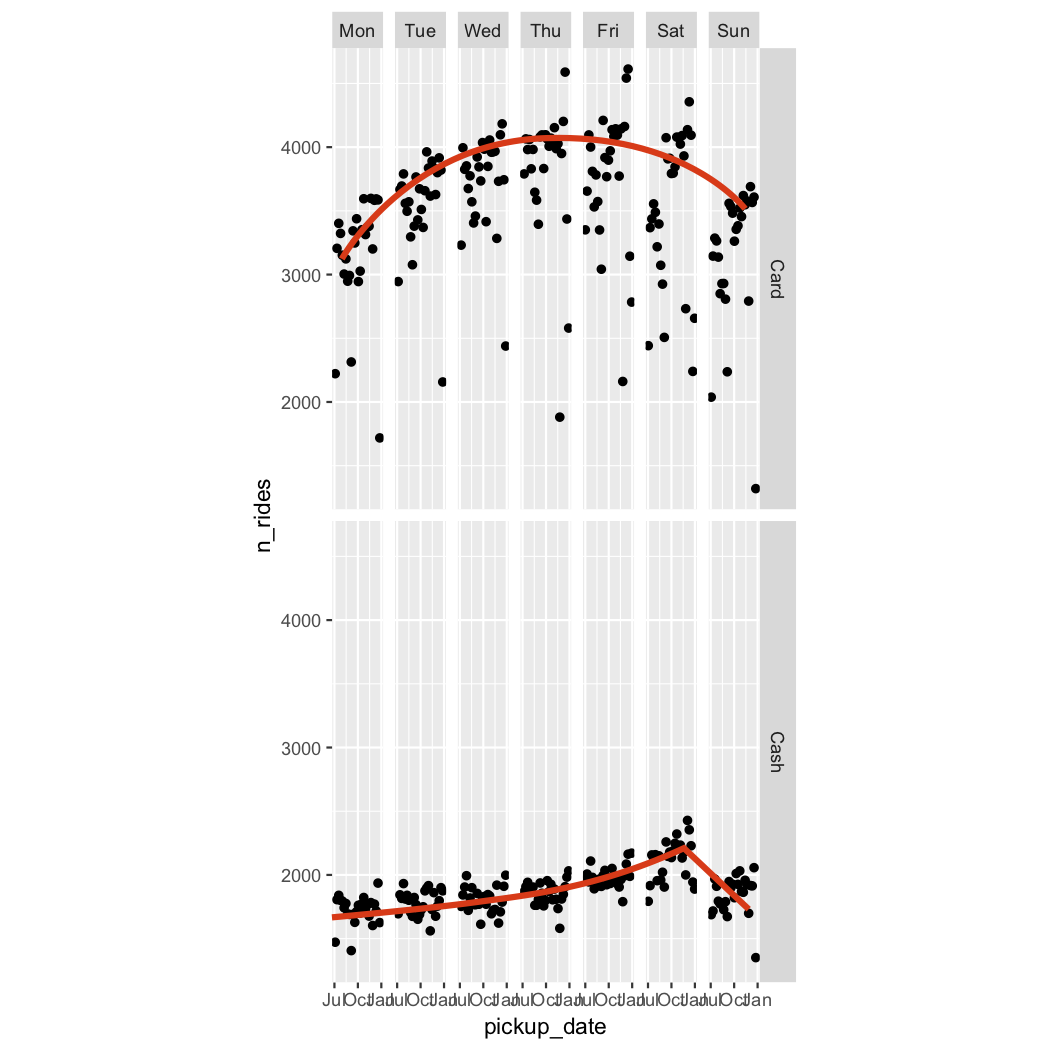
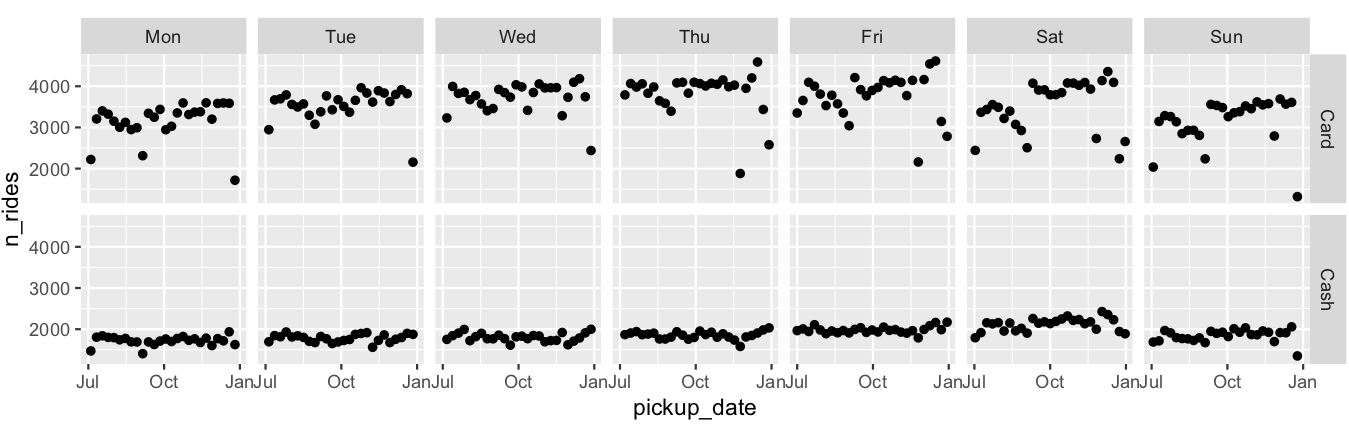
图形纵横比

使用 R 中的 Trelliscope 可视化大数据

图形纵横比

使用 R 中的 Trelliscope 可视化大数据

图形纵横比

trelliscope(dat, width = 600, height = 300, ...)

ggplot(...) + ... + facet_trelliscope(width = 600, height = 300, ...)
使用 R 中的 Trelliscope 可视化大数据

默认查看器状态

trelliscope(dat, state = ..., ...)

ggplot(...) + ... + facet_trelliscope(state = ..., ...)
使用 R 中的 Trelliscope 可视化大数据

Let's practice!

使用 R 中的 Trelliscope 可视化大数据

Preparing Video For Download...