差异结合检测

在 R 中使用 Bioconductor 进行 ChIP-seq 分析

Peter Humburg

Statistician, Macquarie University

比较 ChIP-seq 样本组

  • 用读段计数的统计分析识别组间显著差异。
  • DiffBind 提供分析工具接口。
    • 可用 DESeq2 或 edgeR。
在 R 中使用 Bioconductor 进行 ChIP-seq 分析

创建共享峰集

在共享峰集中计数:

peak_counts <- dba.count(qc_output, summits=250)
在 R 中使用 Bioconductor 进行 ChIP-seq 分析

建立对比

创建对比:

peak_counts <- dba.contrast(peak_counts, categories = DBA_CONDITION)

其他支持的类别:

  • DBA_ID
  • DBA_TISSUE
  • DBA_FACTOR
  • DBA_TREATMENT
  • DBA_REPLICATE
  • DBA_CALLER
在 R 中使用 Bioconductor 进行 ChIP-seq 分析

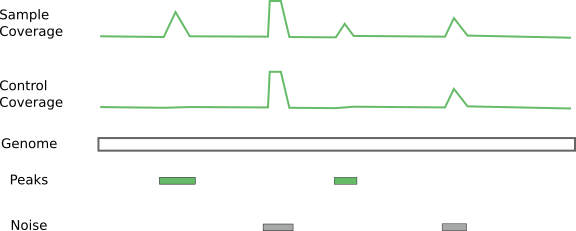
使用对照

对照示意图

在 R 中使用 Bioconductor 进行 ChIP-seq 分析

运行分析

bind_diff <- dba.analyze(peak_counts)
在 R 中使用 Bioconductor 进行 ChIP-seq 分析

结果初探

差异结合峰的PCA图

dba.plotPCA(bind_diff, DBA_Condition, contrast=1)

差异结合峰的热图

dba.plotHeatmap(bind_diff, DBA_Condition, contrast=1)
在 R 中使用 Bioconductor 进行 ChIP-seq 分析

Passons à la pratique !

在 R 中使用 Bioconductor 进行 ChIP-seq 分析

Preparing Video For Download...