非线性响应模型

在 R 中构建响应模型

Kathrin Gruber

Assistant Professor of Econometrics Erasmus University Rotterdam

线性响应函数

  • PRICE 为 0 或非常大时会怎样?
  • 阈值效应如何?

在 R 中构建响应模型

指数响应函数

  • 假设恒定的百分比变化(增长率)。


在 R 中构建响应模型

线性化

  • 非线性模型:$\ \ \ \ \ \ \ \ \ \textsf{Sales} \ \ = \ \ \ \ \beta_0 \star \exp(\beta_1 \star \textsf{Price})$

  • 线性化模型:$\ \log (\textsf{Sales}) = \ \log (\beta_0) + (\beta_1 \star \textsf{Price})$

log.model <- lm(log(SALES) ~ PRICE, data = sales.data)

coef(log.model)
(Intercept)       PRICE 
  5.0843983  -0.6622516
  • 百分比变化:$\beta_1 \star 100$ =(负)66 %
在 R 中构建响应模型

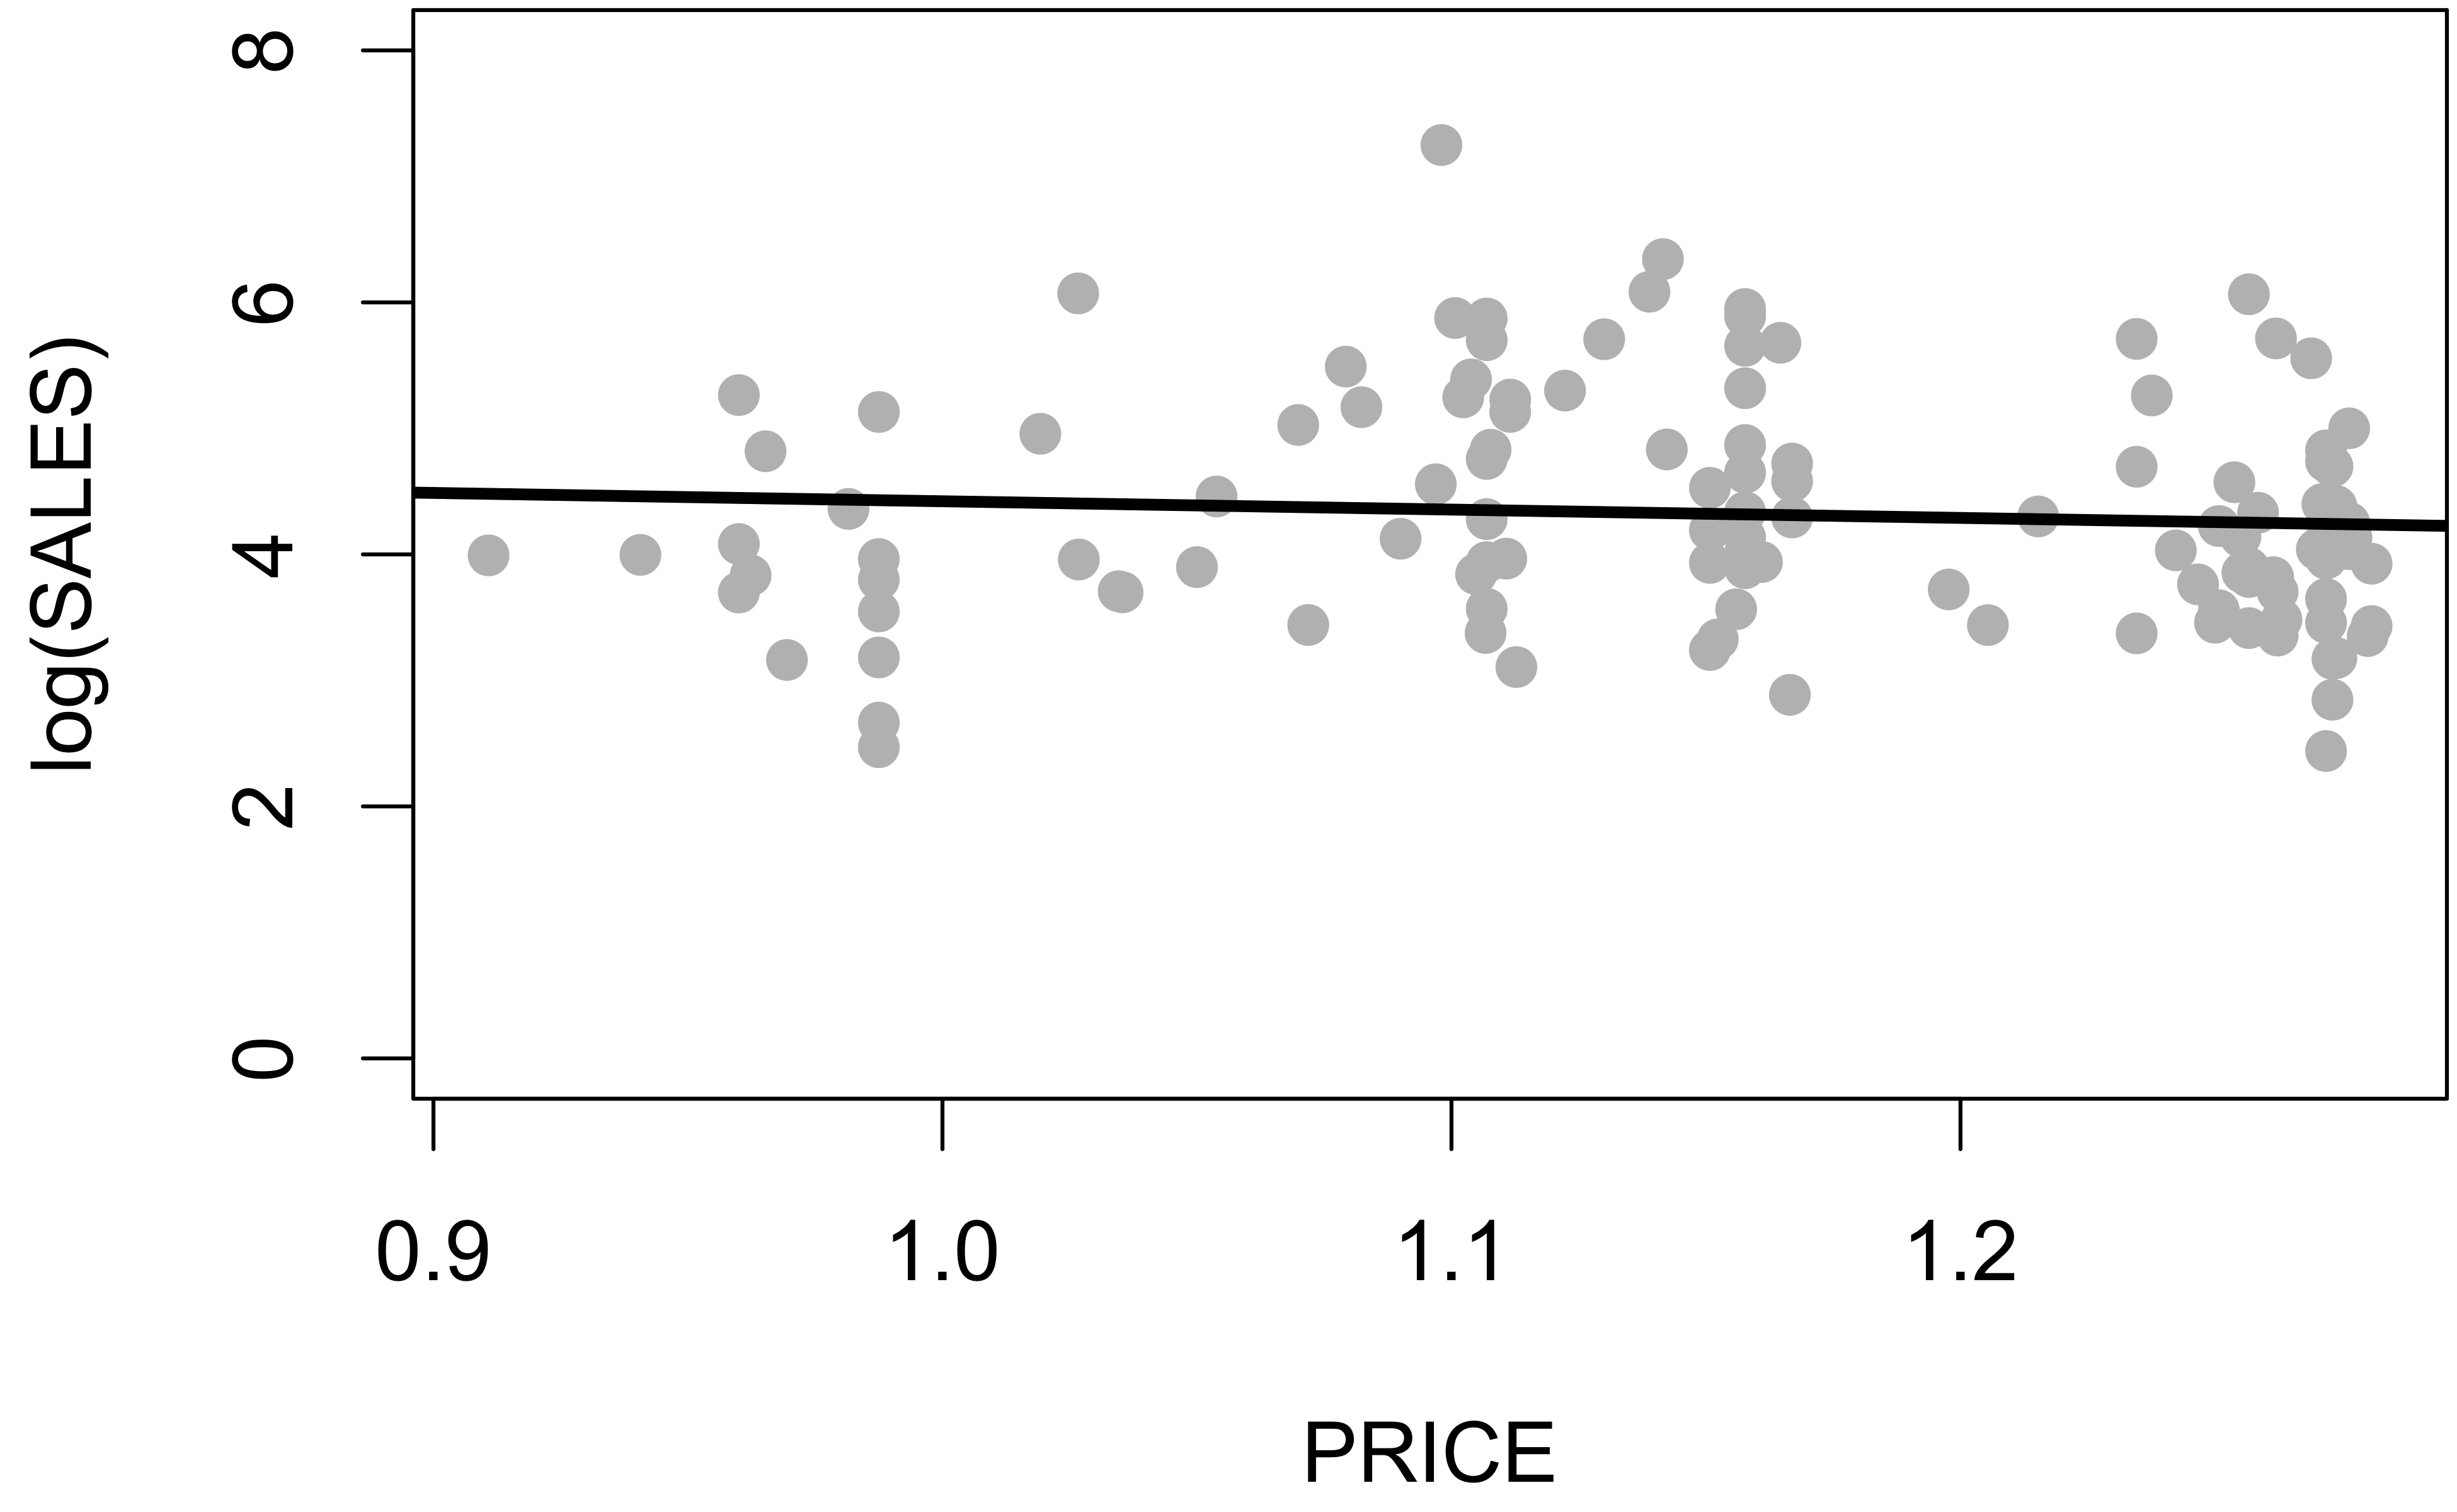
价值何在?

plot(log(SALES) ~ PRICE, data = sales.data)
log.model <- lm(log(SALES) ~ PRICE, data = sales.data)
abline(log.model)
在 R 中构建响应模型

让我们来练习!

在 R 中构建响应模型

Preparing Video For Download...