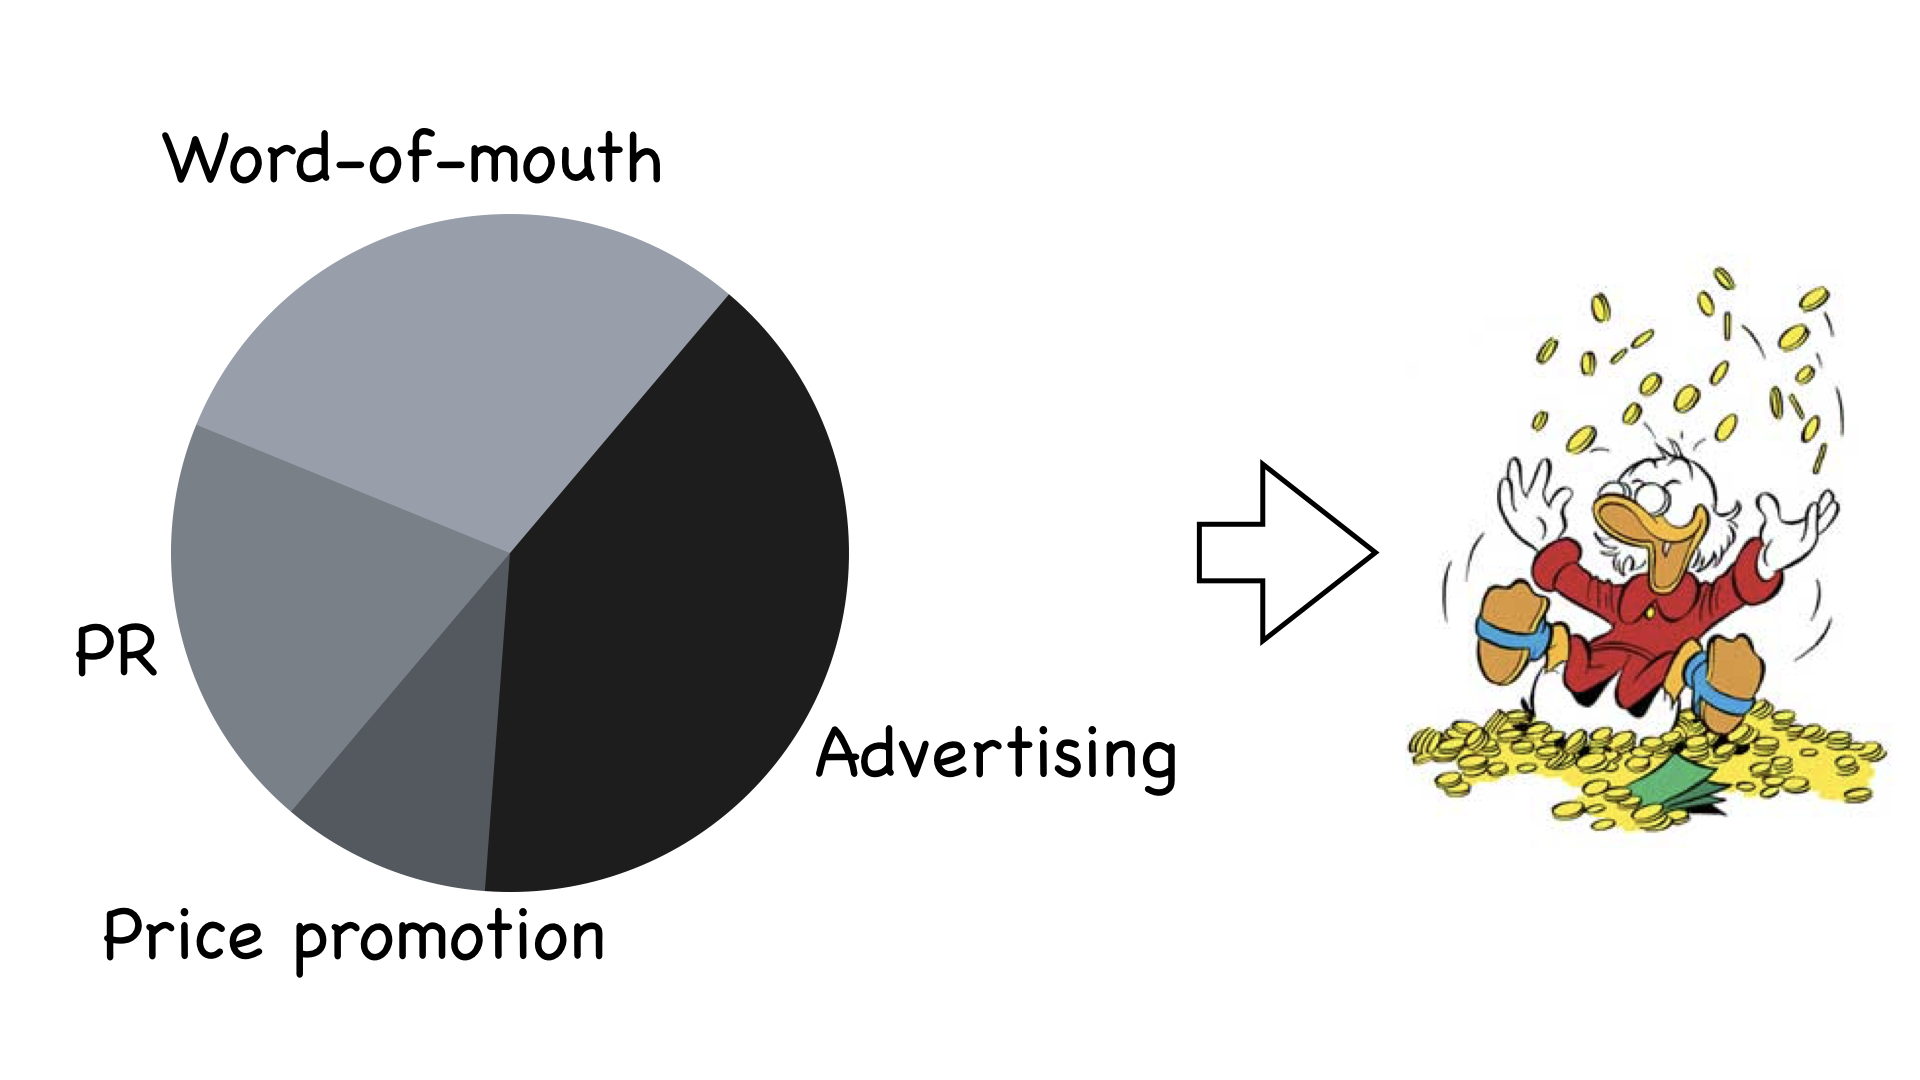
在 R 中构建响应模型
Kathrin Gruber
Assistant Professor of Econometrics Erasmus University Rotterdam
利用历史数据来:
优化营销战术与策略。
检验营销方案效果。
str(sales.data)
'data.frame':    124 obs. of  6 variables:
 $ OBS          : int  1 2 3 4 5 6 7 8 9 10 ...
 $ SALES        : num  22.6 22.9 80.6 85.1 81.9 ...
 $ PRICE        : num  1.09 1.27 1.27 1.27 1.27 ...
 $ DISPLAY      : int  0 0 0 0 0 0 0 0 0 0 ...
 $ COUPON       : int  0 0 0 0 0 0 0 0 0 1 ...
 $ DISPLAYCOUPON: int  0 0 0 0 0 0 0 0 0 0 ...
OBS
SALES
PRICE
DISPLAY
COUPON
DISPLAYCOUPON
mean(sales.data$SALES)
119.7319
min(sales.data$SALES)
11.66749
max(sales.data$SALES)
752.7219