可视化预测

使用 rstanarm 进行贝叶斯回归建模

Jake Thompson

Psychometrician, ATLAS, University of Kansas

绘制新预测

stan_model <- stan_glm(kid_score ~ mom_iq + mom_hs, data = kidiq)
predict_data <- data.frame(mom_iq = 110, mom_hs = c(0, 1))

posterior <- posterior_predict(stan_model, newdata = predict_data) posterior[1:10,]
              1         2
 [1,]  76.75484  96.26407
 [2,]  74.39001 100.38898
 [3,]  90.90370  70.00591
 [4,]  70.43835 120.82787
 [5,] 113.98411  82.40497
 [6,]  56.15829 121.84269
 [7,]  90.46640  92.77966
 [8,]  98.56337 110.17948
 [9,] 108.86147 123.67762
[10,]  94.29429  83.77102
使用 rstanarm 进行贝叶斯回归建模

整理数据

posterior <- as.data.frame(posterior)

colnames(posterior) <- c("未高中", "已高中")
plot_posterior <- gather(posterior, key = "HS", value = "predict")
head(plot_posterior)
     HS   predict
1 未高中  76.75484
2 未高中  74.39001
3 未高中  90.90370
4 未高中  70.43835
5 未高中 113.98411
6 未高中  56.15829
使用 rstanarm 进行贝叶斯回归建模

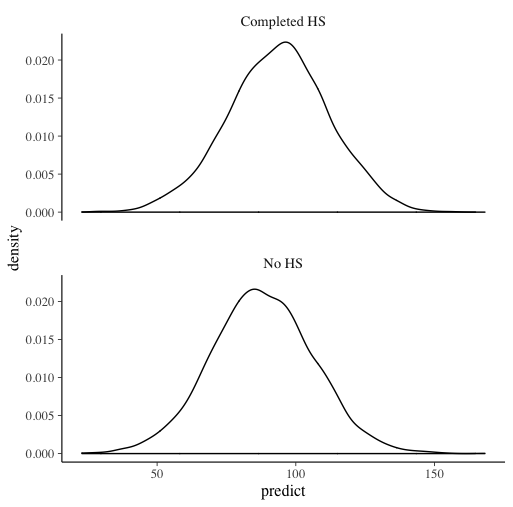
创建图表

ggplot(plot_posterior, aes(x = predict)) +
  facet_wrap(~ HS, ncol = 1) +
  geom_density()
使用 rstanarm 进行贝叶斯回归建模

让我们来练习

使用 rstanarm 进行贝叶斯回归建模

Preparing Video For Download...