R 异常检测入门
Alastair Rushworth
Data Scientist
h_seq <- seq(min(furniture$Height), max(furniture$Height), length.out = 20)
w_seq <- seq(min(furniture$Width), max(furniture$Width), length.out = 20)
seq() 参数
from - 下界to - 上界length.out - 序列中的值数furniture_grid <- expand.grid(Width = w_seq, Height = h_seq)head(furniture_grid)
Width Height
1 46.85100 44.359
2 51.48663 44.359
3 56.12225 44.359
4 60.75788 44.359
5 65.39351 44.359
6 70.02913 44.359
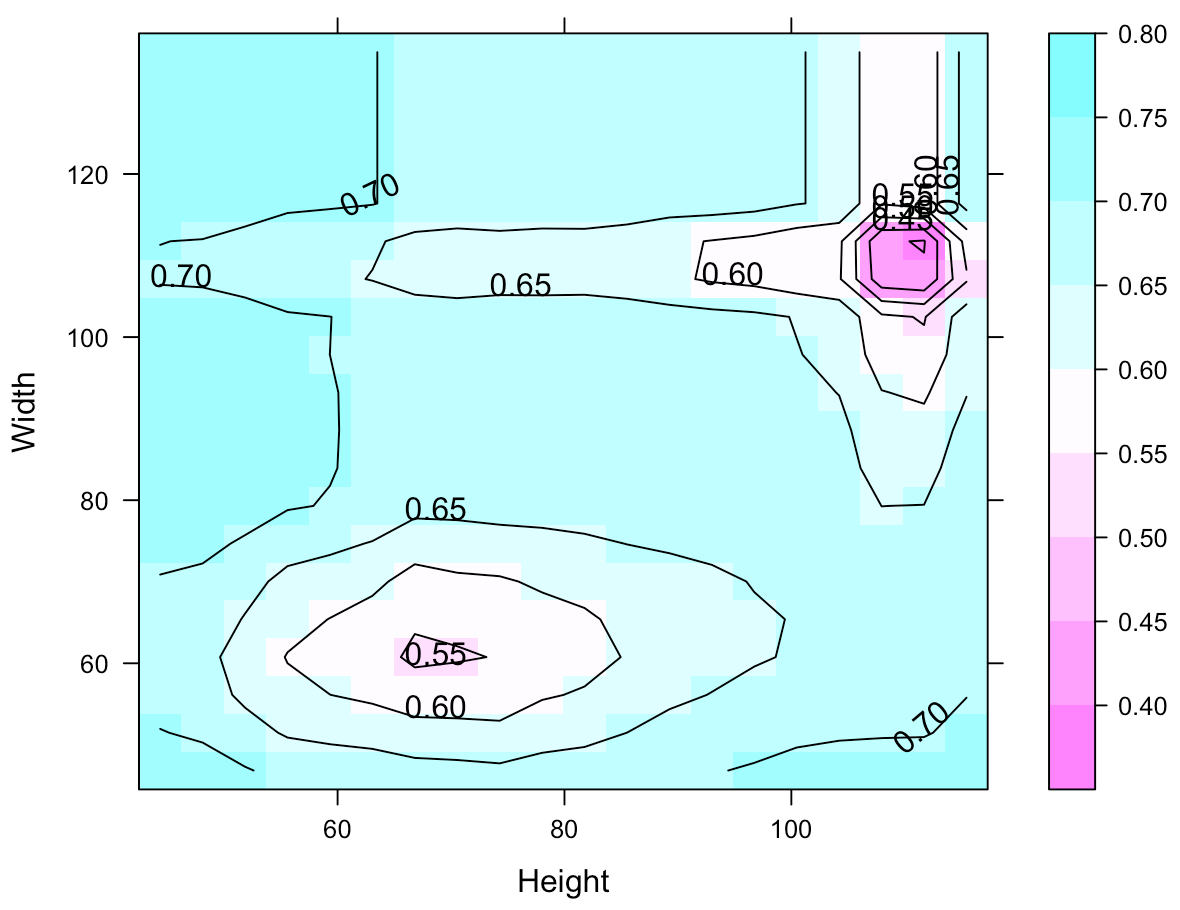
furniture_grid$score <- predict(furniture_forest, furniture_grid)
library(lattice)
contourplot(score ~ Height + Width, data = furniture_grid,
region = TRUE)
R 异常检测入门