检测季节性时间序列中的多重异常

R 异常检测入门

Alastair Rushworth

Data Scientist

月度收入数据

head(msales)
  sales month
1 6.068     1
2 5.966     2
3 6.133     3
4 6.230     4
5 6.407     5
6 6.433     6

此处不适用 Grubbs 检验

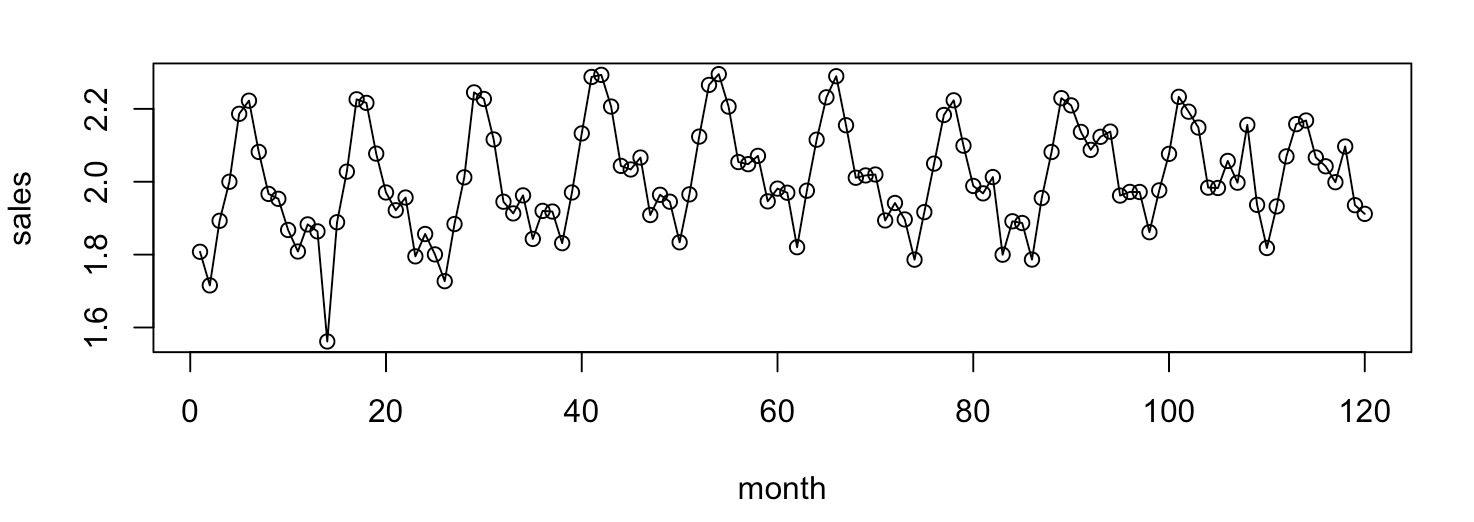
  • 可能存在季节性
  • 可能有多个异常
R 异常检测入门

可视化月度收入

plot(sales ~ month, data = msales, type = 'o')
R 异常检测入门

季节性混合 ESD 算法用法

library(AnomalyDetection)
sales_ad <- AnomalyDetectionVec(x = msales$sales, period = 12, 
                                direction = 'both')

参数

  • x:数值向量
  • period:重复模式的周期
  • direction:查找较小('neg')、较大('pos')或两者('both')的异常

软件包下载: https://github.com/twitter/AnomalyDetection

R 异常检测入门

季节性混合 ESD 算法输出

sales_ad <- AnomalyDetectionVec(x = msales$sales, period = 12, 
                                direction = 'both')
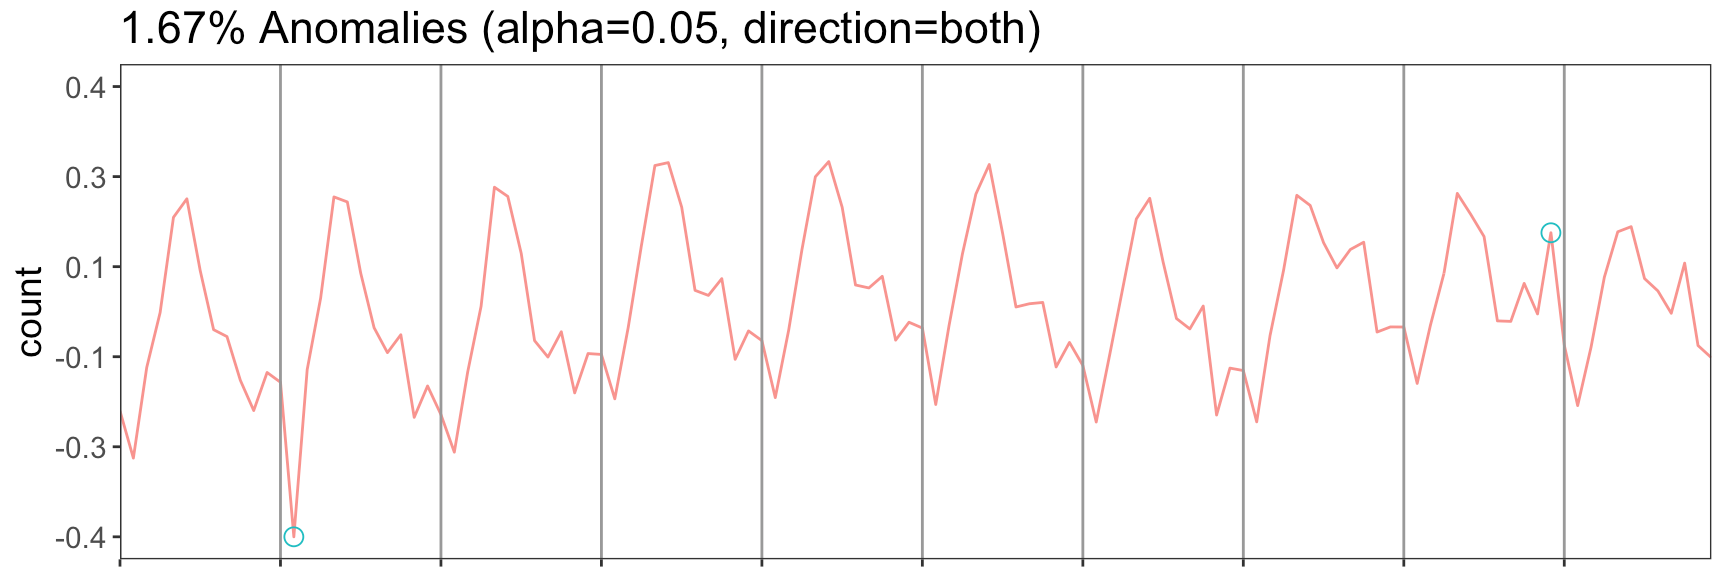
sales_ad$anoms
  index anoms
1    14 1.561
2   108 2.156
R 异常检测入门

季节性混合 ESD 算法绘图

AnomalyDetectionVec(x = msales$sales, period = 12, 
                    direction = 'both', plot = T)
R 异常检测入门

Ayo berlatih!

R 异常检测入门

Preparing Video For Download...