选择策略

R 中级交互式数据可视化(plotly)

Adam Loy

Statistician, Carleton College

两种选择策略
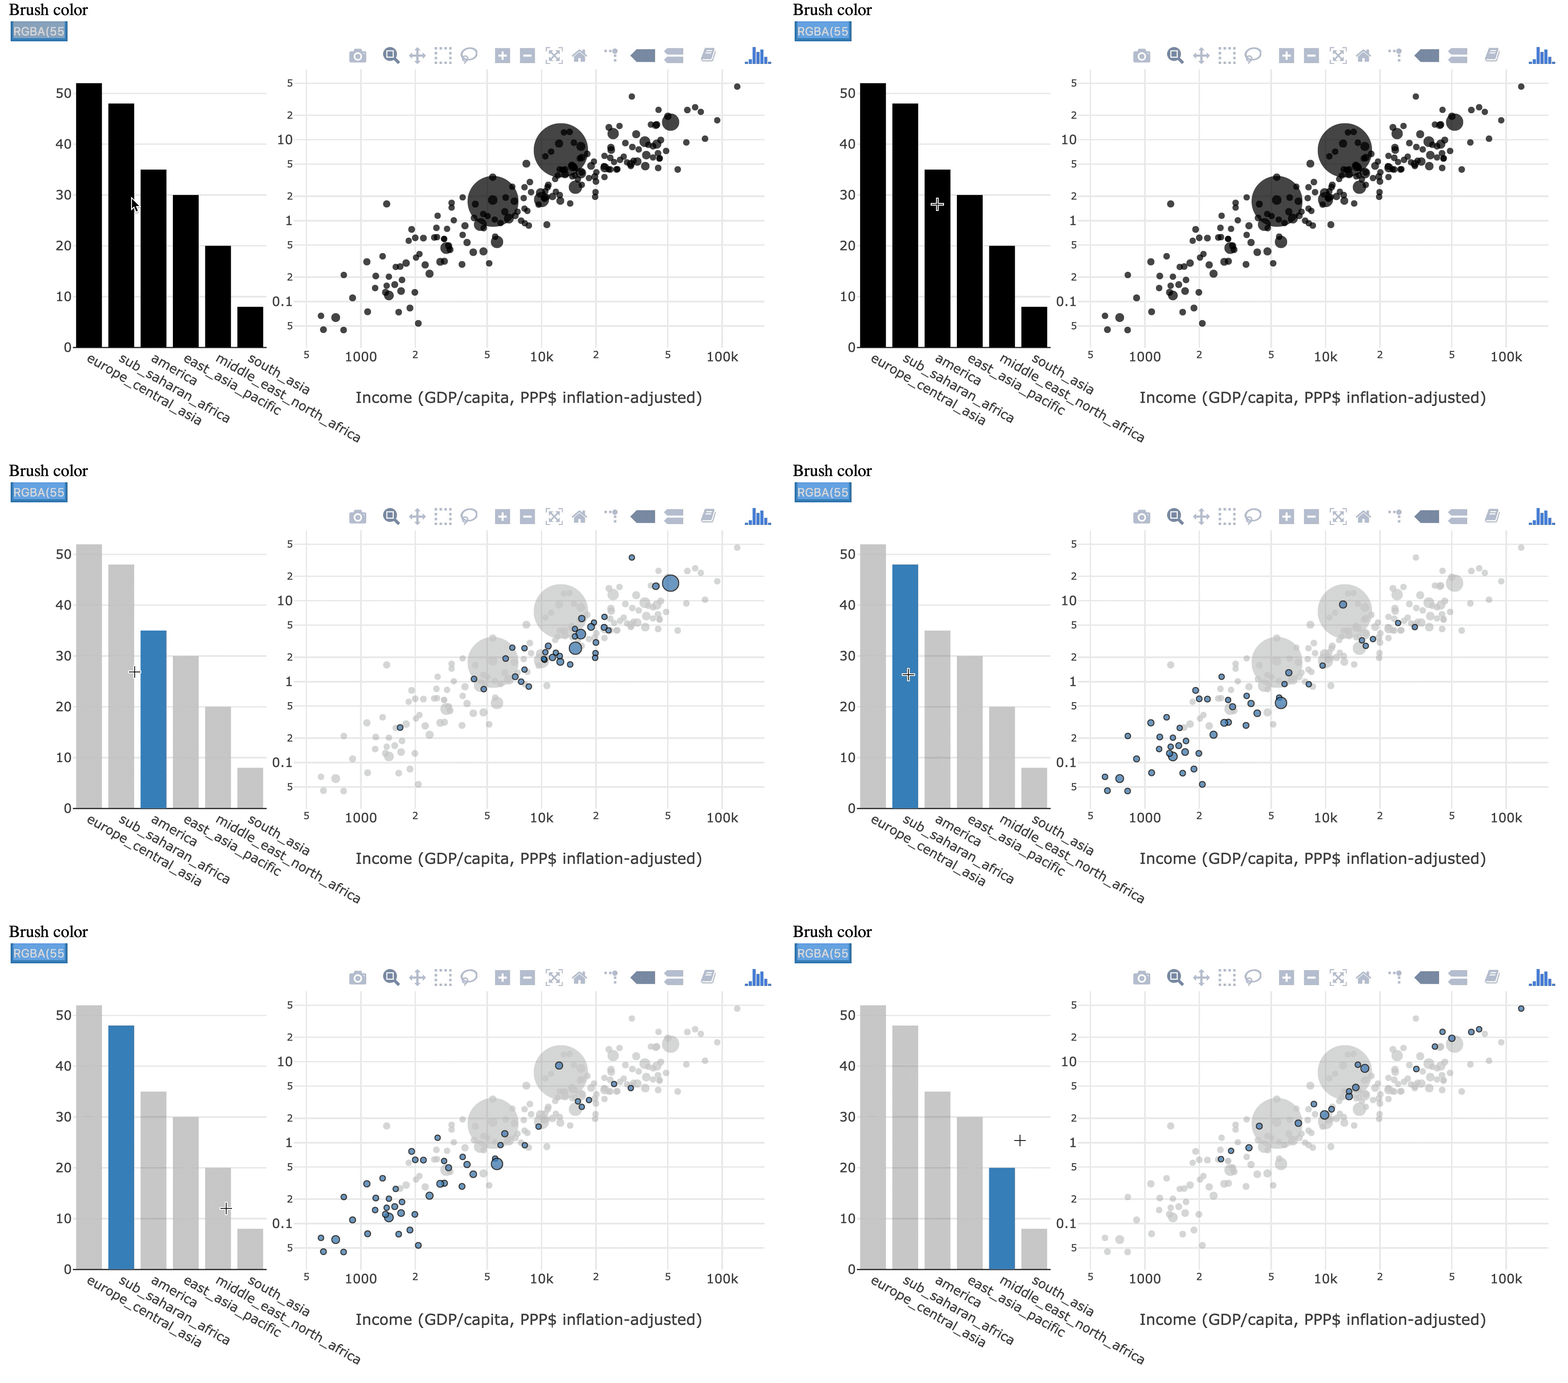
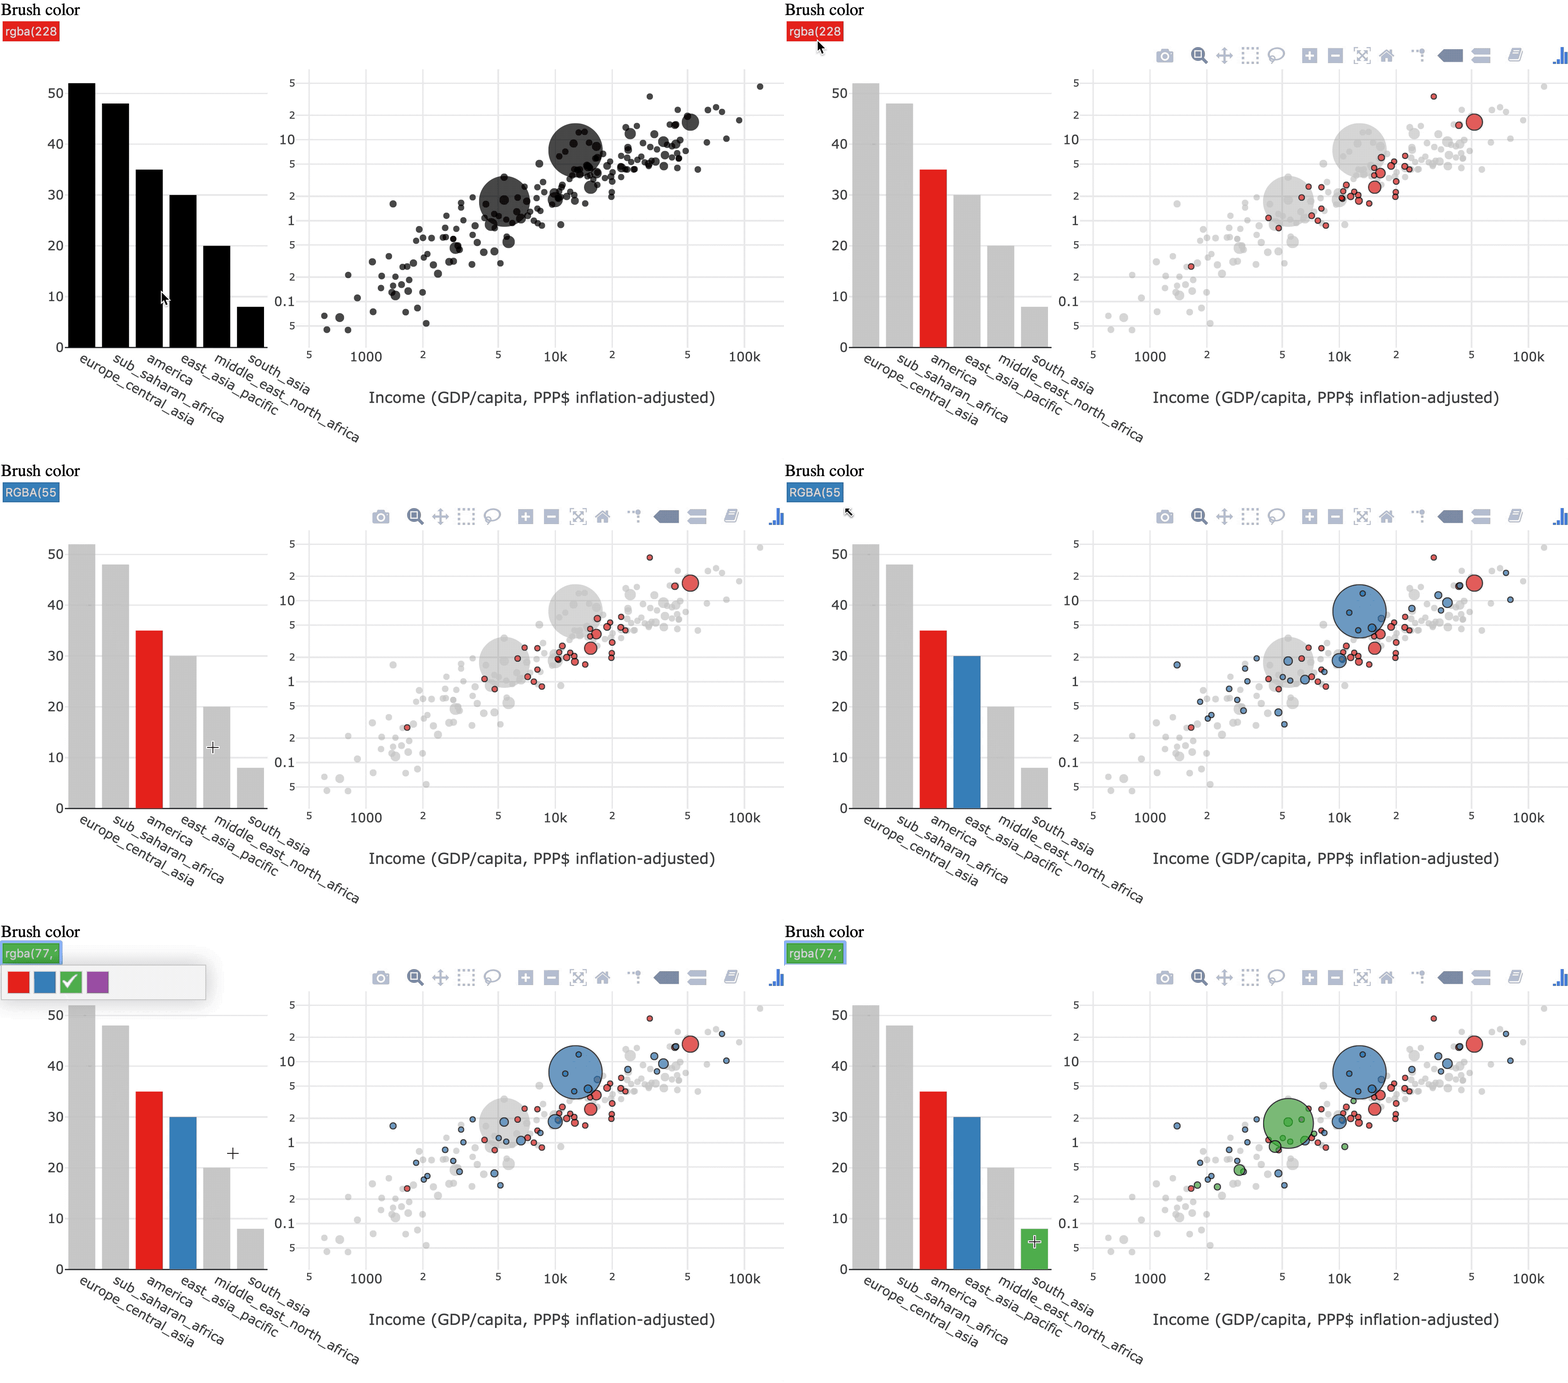
瞬时选择

先前选中的项会被忘记

linking_teaser1.gif

持久选择

选中的项会累积

linking_teaser2.gif

R 中级交互式数据可视化(plotly)

示例

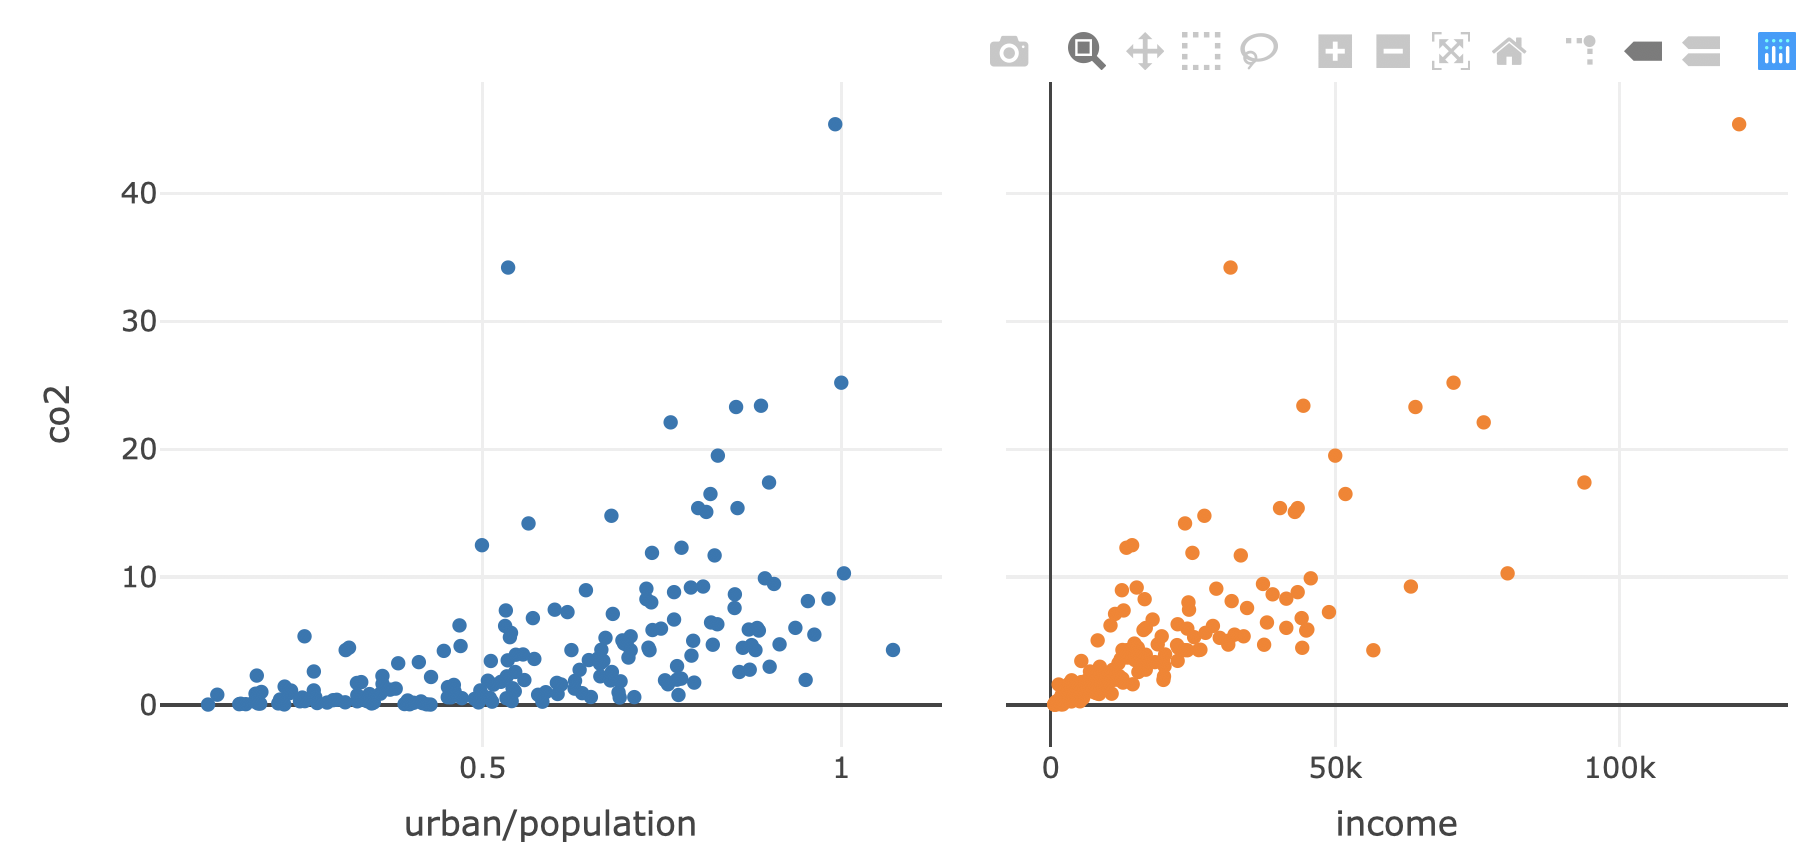
before_persistent_selection.png

R 中级交互式数据可视化(plotly)

生成基础图表

shared_data <- world2014 %>% SharedData$new()

p1 <- shared_data %>%
  plot_ly(x=~urban/population, y = ~co2, text = ~country) %>%
  add_markers()

p2 <- shared_data %>%
  plot_ly(x=~income, y = ~co2, text = ~country) %>%
  add_markers()

subplot(p1, p2, titleX = TRUE, shareY = TRUE) %>% 
  hide_legend()
R 中级交互式数据可视化(plotly)

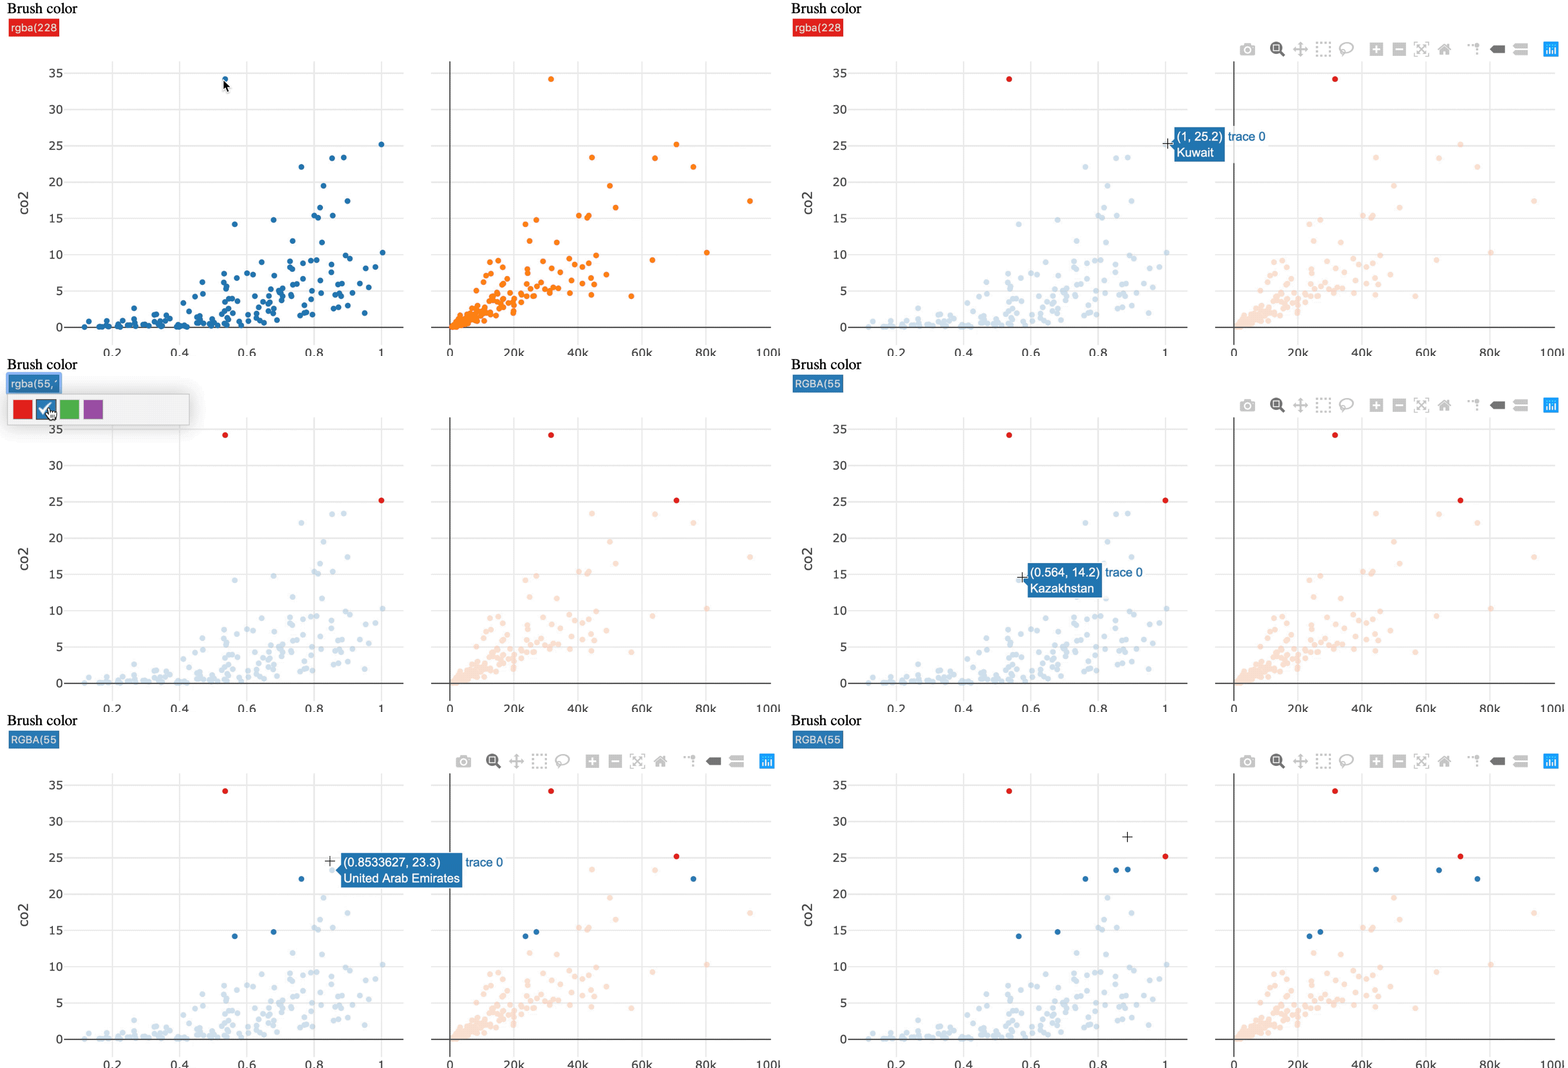
持久选择

通过 highlight() 启用持久选择

subplot(p1, p2, titleX = TRUE, shareY = TRUE) %>% 
  hide_legend() %>%
  highlight(persistent = TRUE)
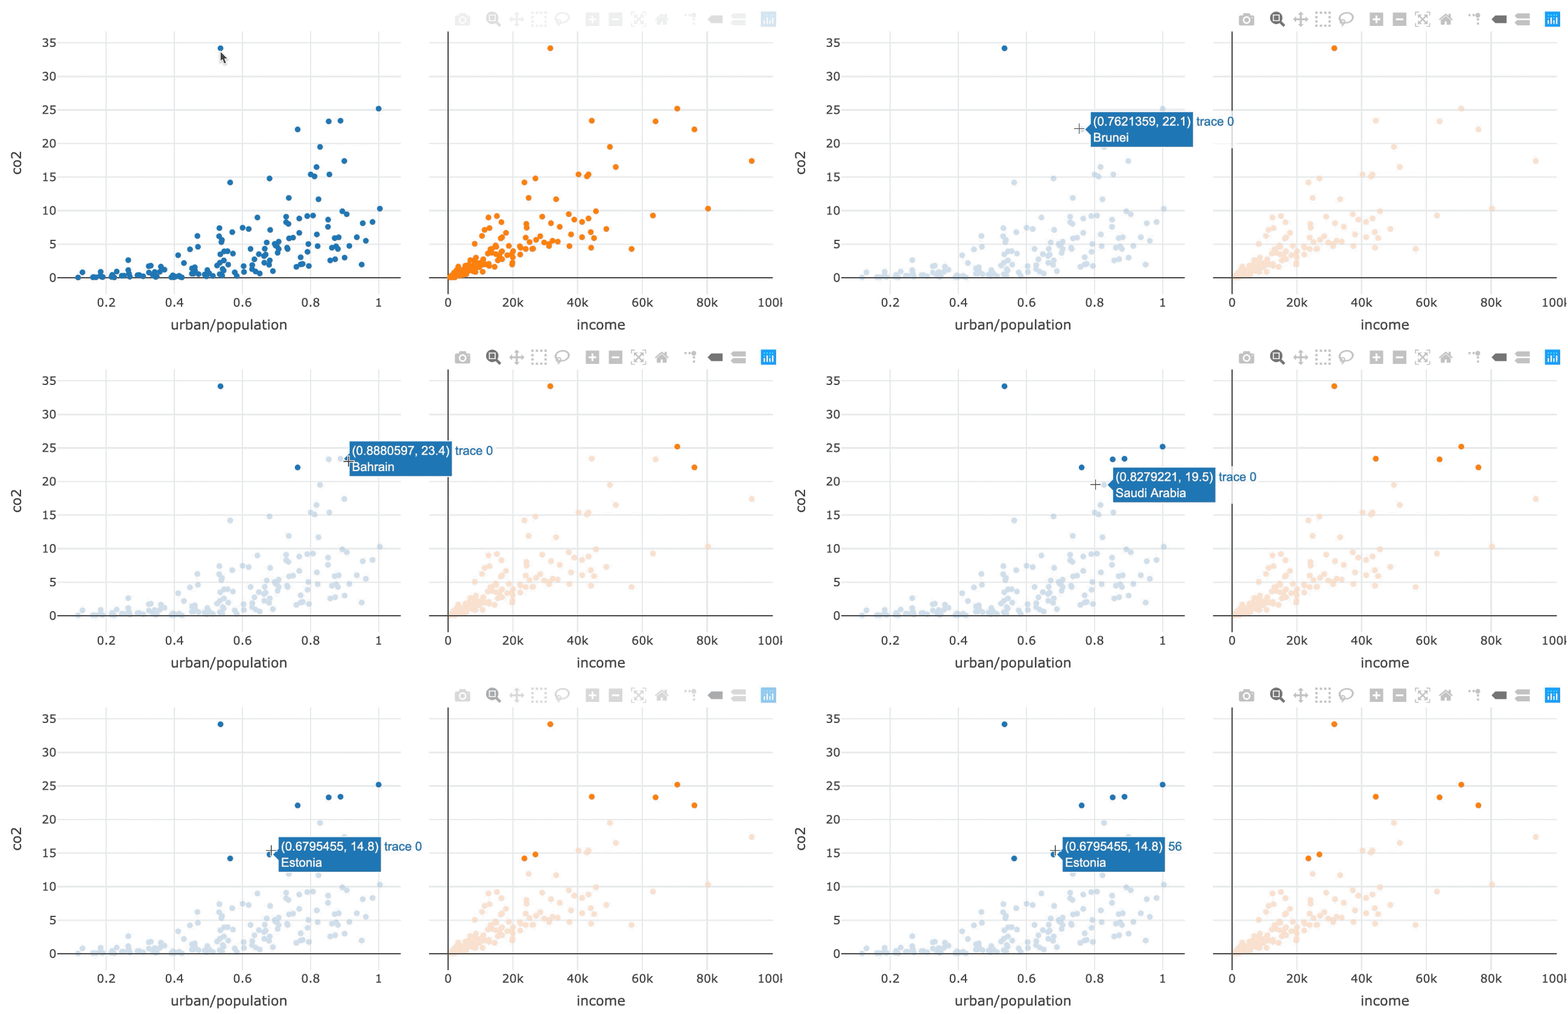
persistent_selection.gif

R 中级交互式数据可视化(plotly)

彩色高亮

dynamic_selection.gif

R 中级交互式数据可视化(plotly)

彩色高亮

添加 dynamic = TRUE 以启用取色器

subplot(p1, p2, titleX = TRUE, shareY = TRUE) %>% 
  hide_legend() %>%
  highlight(persistent = TRUE, dynamic = TRUE)
R 中级交互式数据可视化(plotly)

两种操作方式

直接操作

通过与图形元素交互进行选择

linking_teaser1.gif

间接操作

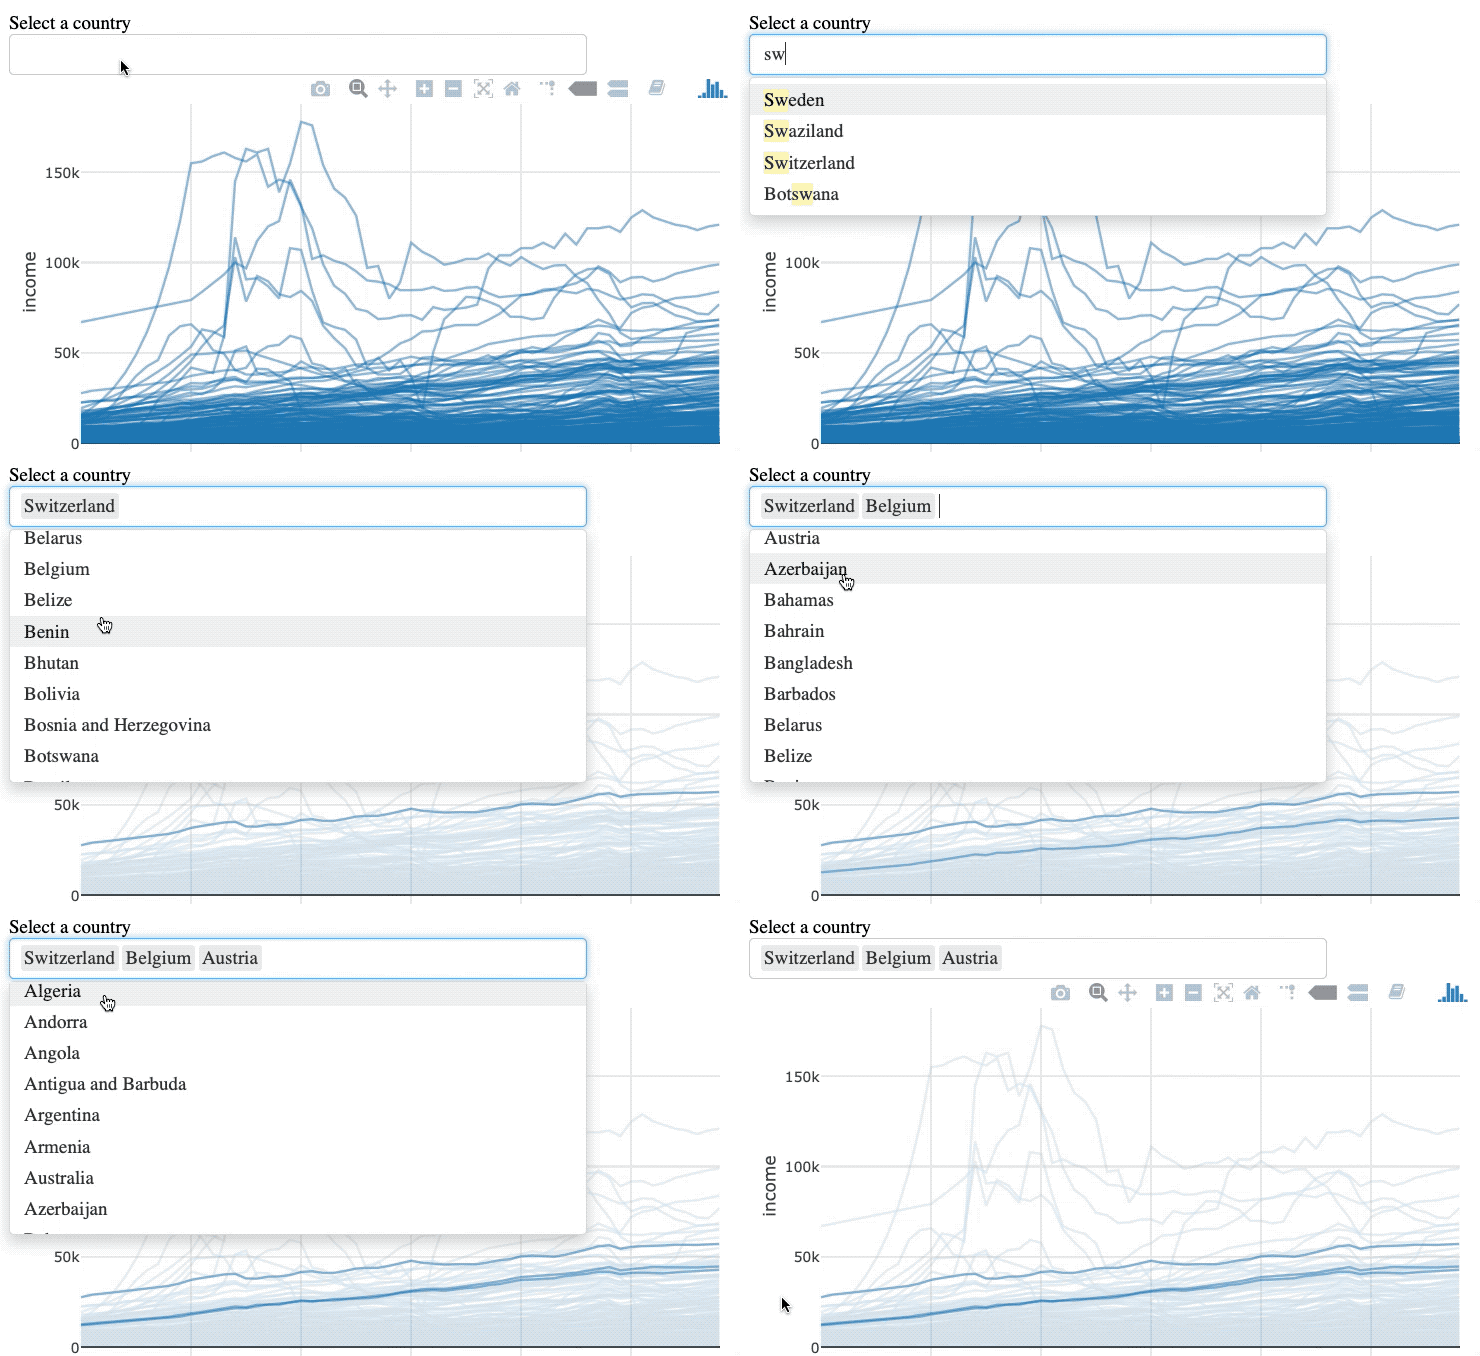
通过图表外的查询进行选择

indirect_manipulation.gif

R 中级交互式数据可视化(plotly)

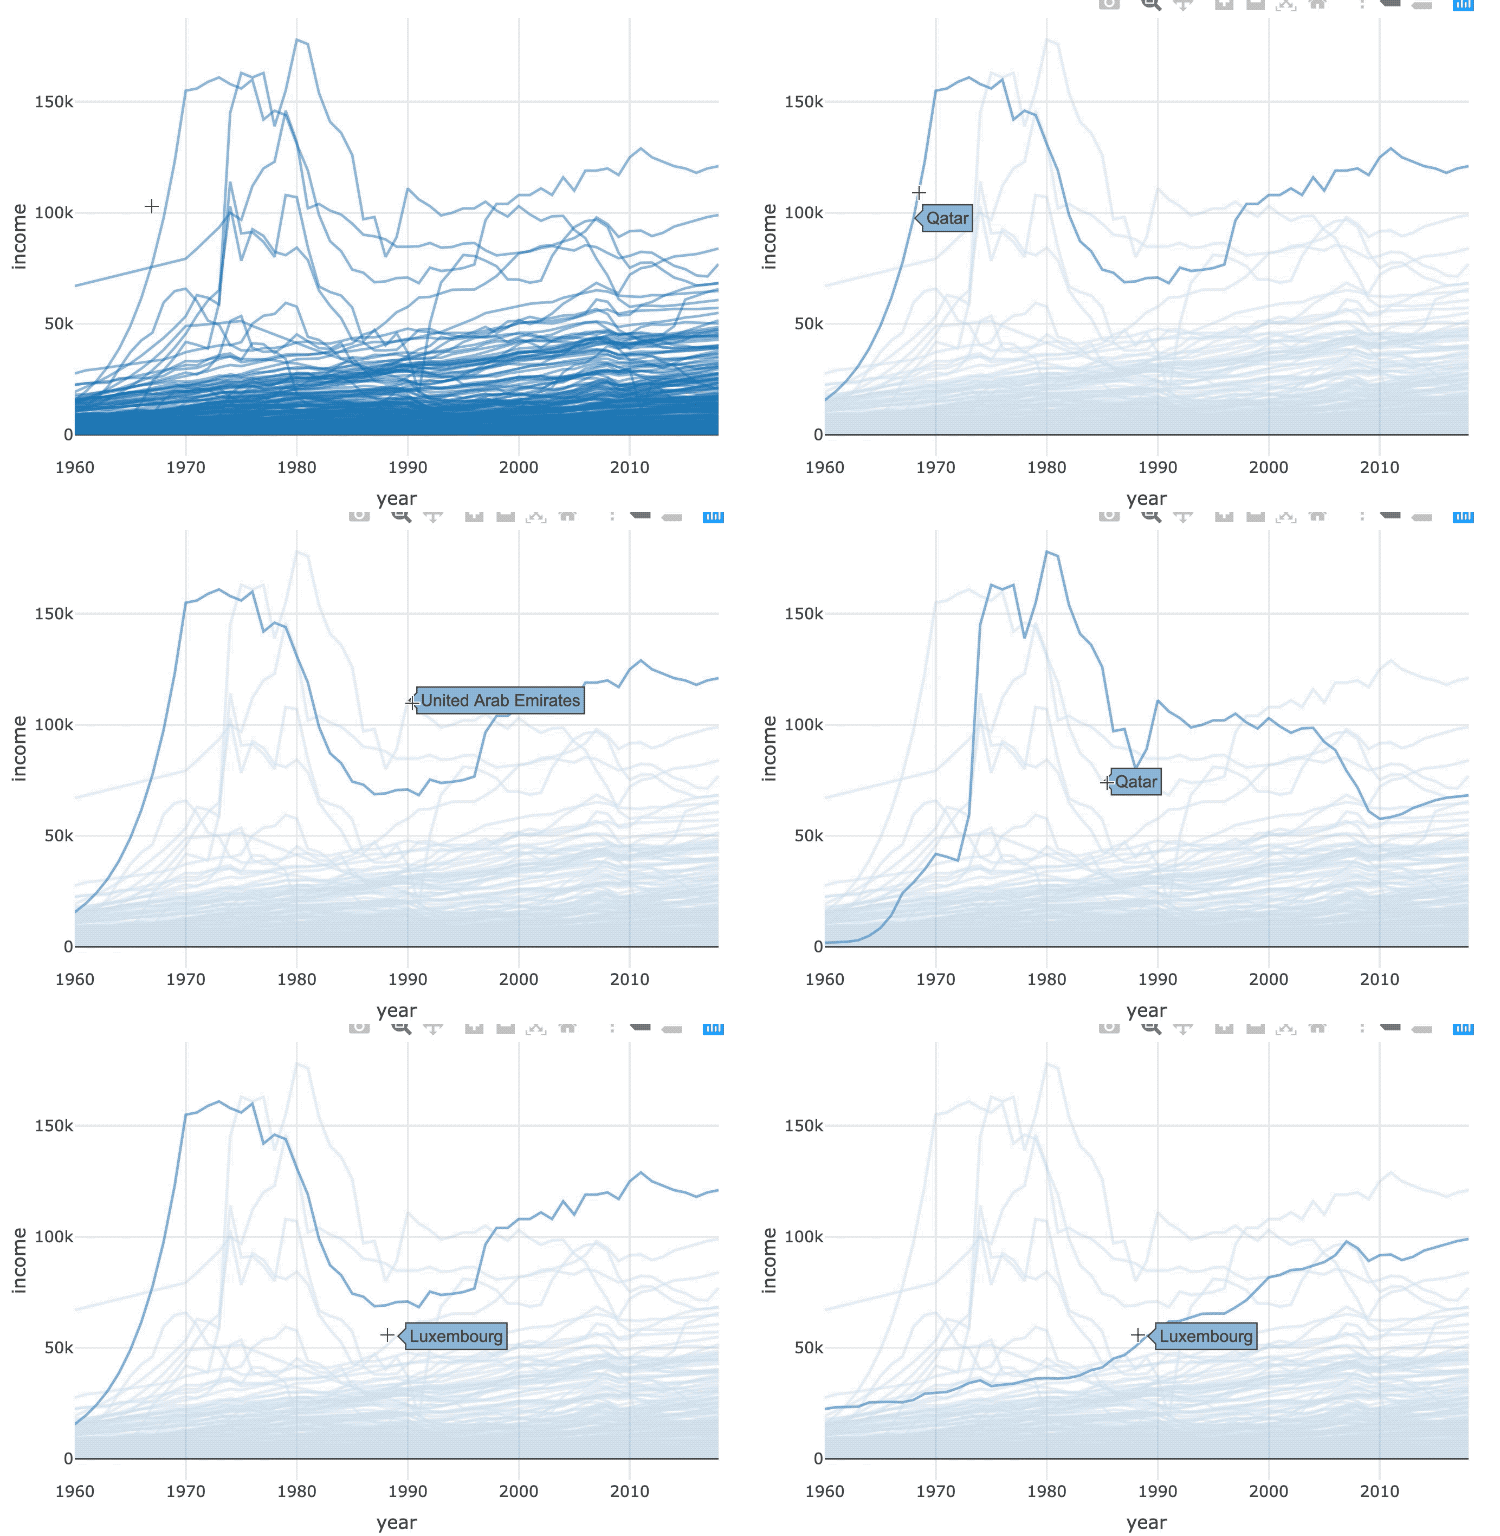
select_time_series.gif

R 中级交互式数据可视化(plotly)

间接操作

world_indicators %>%
  SharedData$new(key = ~country) %>% 
  plot_ly(x = ~year, y = ~income, alpha = 0.5) %>%
  group_by(country) %>%
  add_lines()
R 中级交互式数据可视化(plotly)

间接操作

world_indicators %>%
  SharedData$new(key = ~country, group = "Select a country") %>% 
  plot_ly(x = ~year, y = ~income, alpha = 0.5) %>%
  group_by(country) %>%
  add_lines() %>%
  highlight(selectize = TRUE)
R 中级交互式数据可视化(plotly)

indirect_manipulation.gif

R 中级交互式数据可视化(plotly)

Ayo berlatih!

R 中级交互式数据可视化(plotly)

Preparing Video For Download...