使用文本进行交流
使用 Bokeh 进行交互式数据可视化

George Boorman
Core Curriculum Manager, DataCamp
我们的图
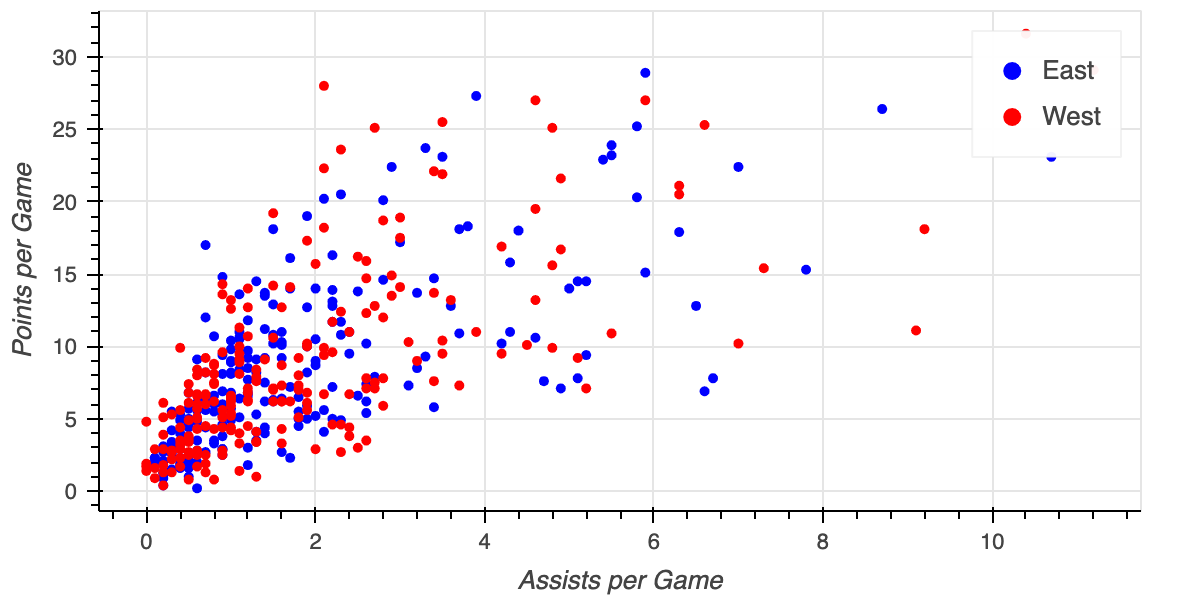
添加标题
fig = figure(x_axis_label='Assists per Game', y_axis_label='Points per Game',title="Points vs. Assists by Conference")fig.circle(x='assists', y='points', source=east, color='blue', legend_label='East') fig.circle(x='assists', y='points', source=west, color='red', legend_label='West') output_file(filename="points_vs_assists_by_conference.html") show(fig)
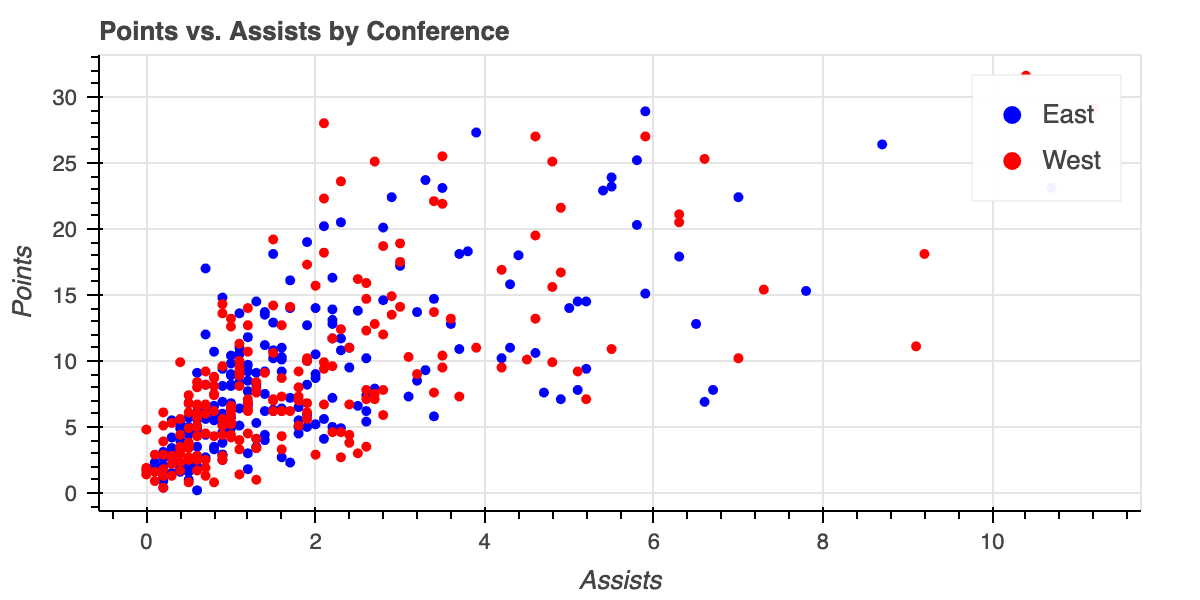
自定义标题
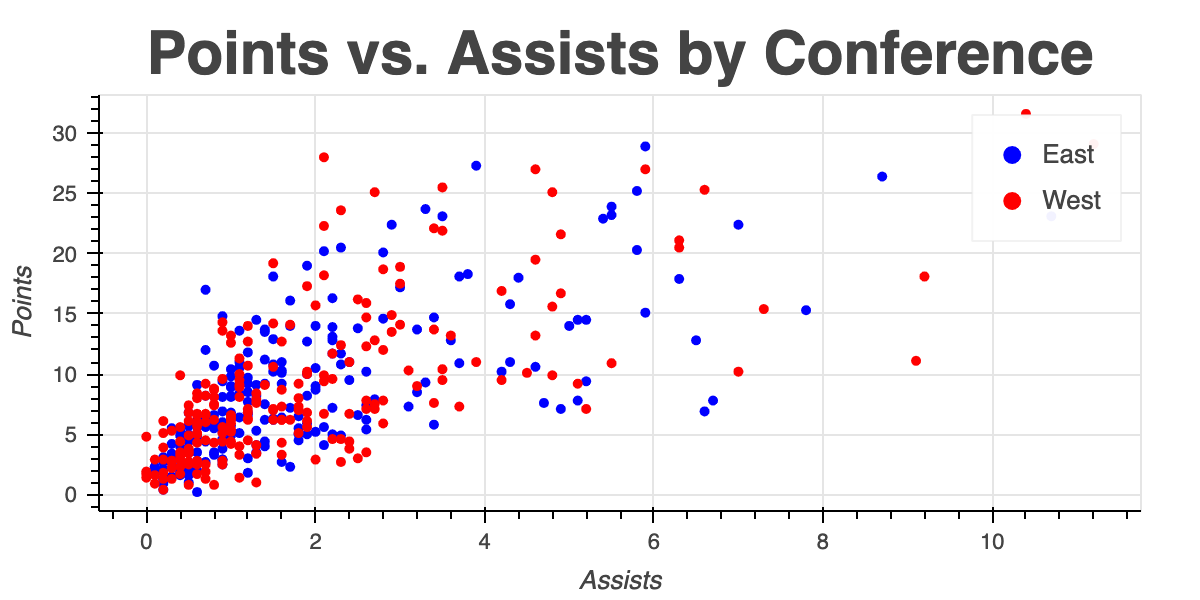
fig.title.text_font_size = "30px"fig.title.align = "center"output_file(filename="modified_title.html") show(fig)
修改图例
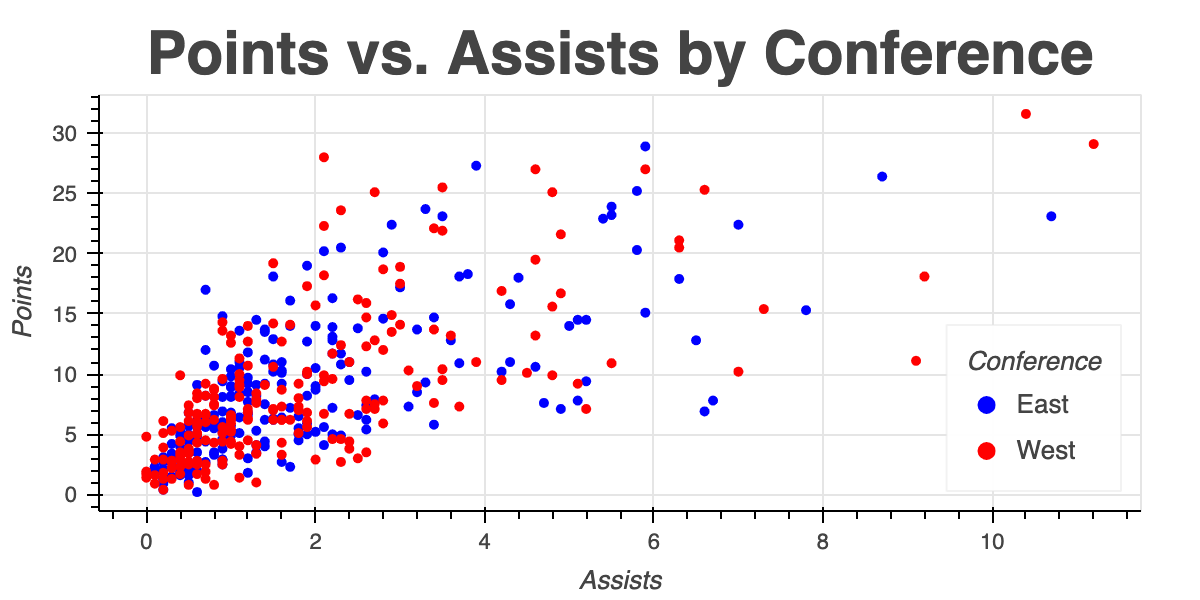
图例标题字体样式
fig.legend.title_text_font_style = "normal"output_file(filename="normal_legend_title.html") show(fig)
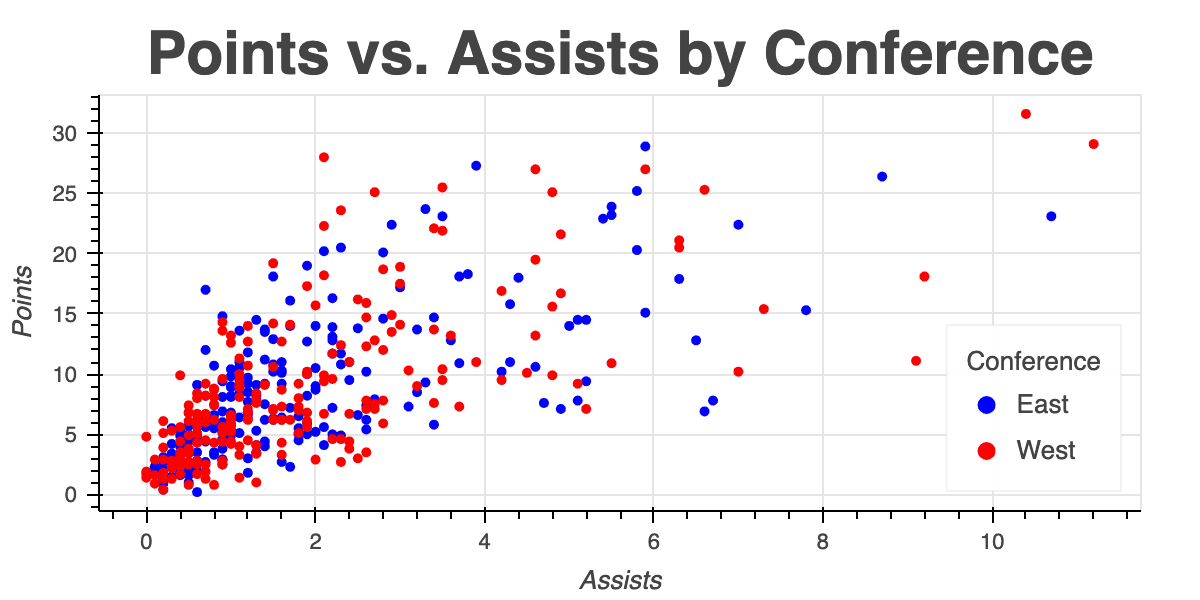
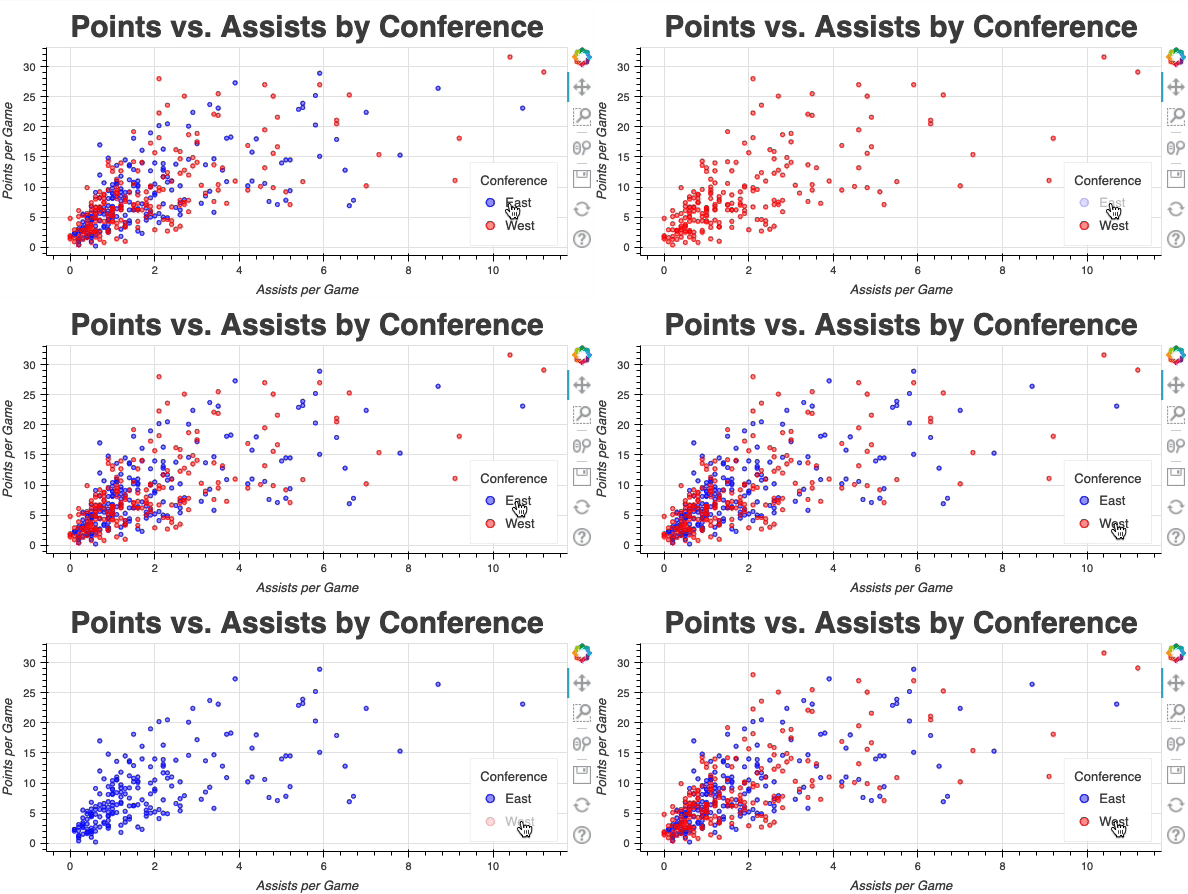
显示交互式图例
fig.legend.click_policy = "hide"output_file(filename="interactive_legend.html") show(fig)