Statistici cu geoms

Vizualizare intermediară a datelor cu ggplot2

Rick Scavetta

Founder, Scavetta Academy

ggplot2, curs 2

  • Statistici
  • Coordonate
  • Fatetare
  • Bune practici în vizualizarea datelor
Vizualizare intermediară a datelor cu ggplot2

Stratul de statistici

  • Două categorii de funcții
    • Apelate din interiorul unui geom
    • Apelate independent
  • stats_
Vizualizare intermediară a datelor cu ggplot2

geom_ <-> stat_

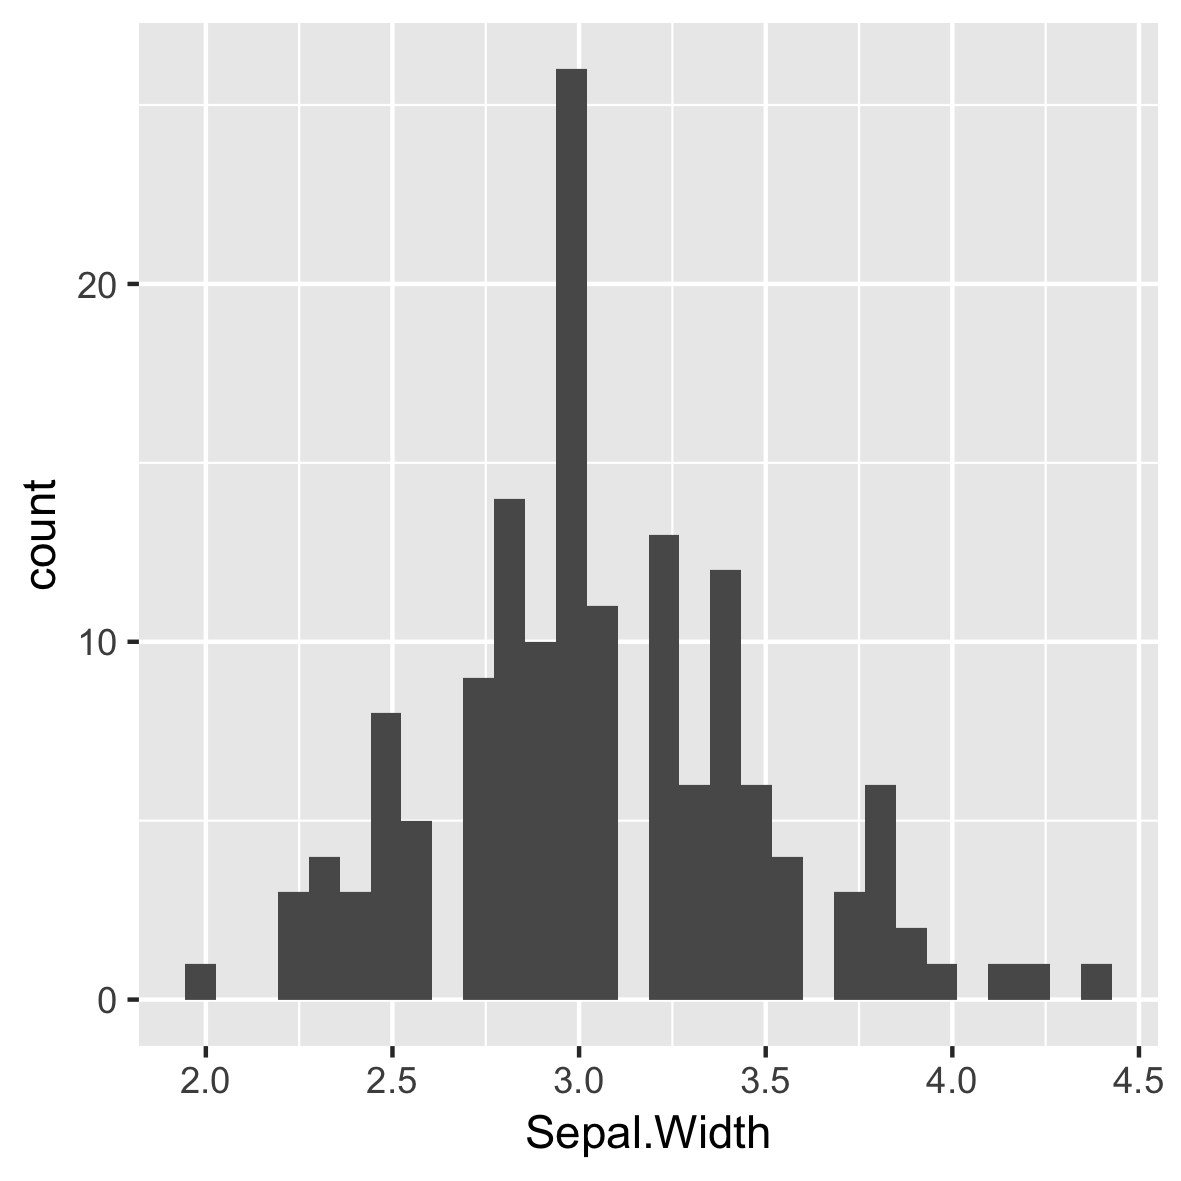
p <- ggplot(iris, aes(x = Sepal.Width))
p + geom_histogram()

geomhistogram

Vizualizare intermediară a datelor cu ggplot2

geom_ <-> stat_

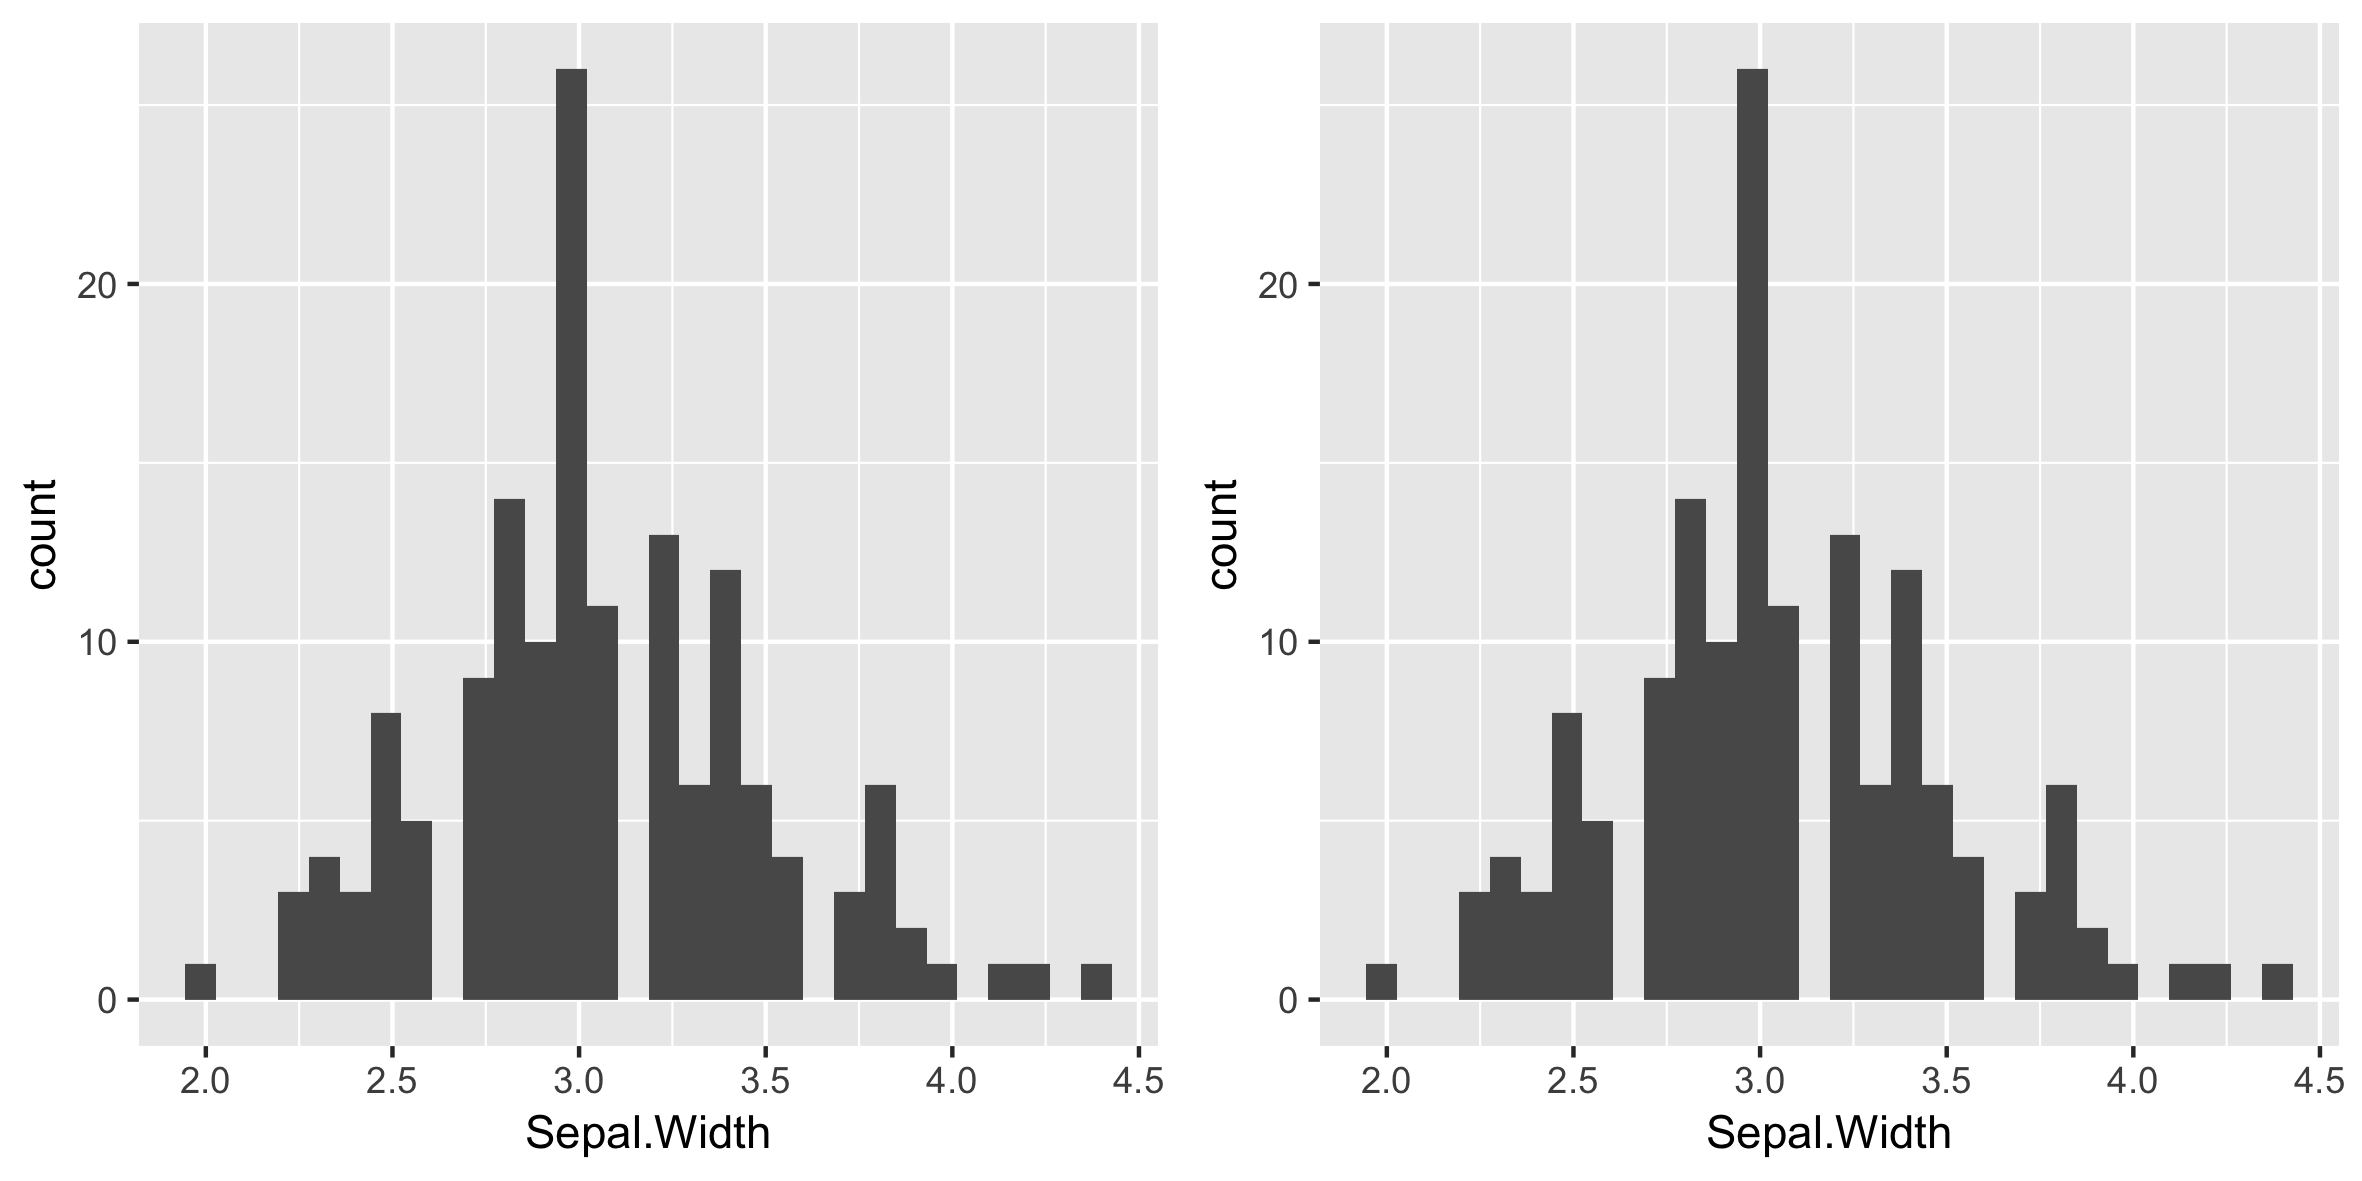
p <- ggplot(iris, aes(x = Sepal.Width))
p + geom_histogram()
p + geom_bar()

geomhistogram

Vizualizare intermediară a datelor cu ggplot2

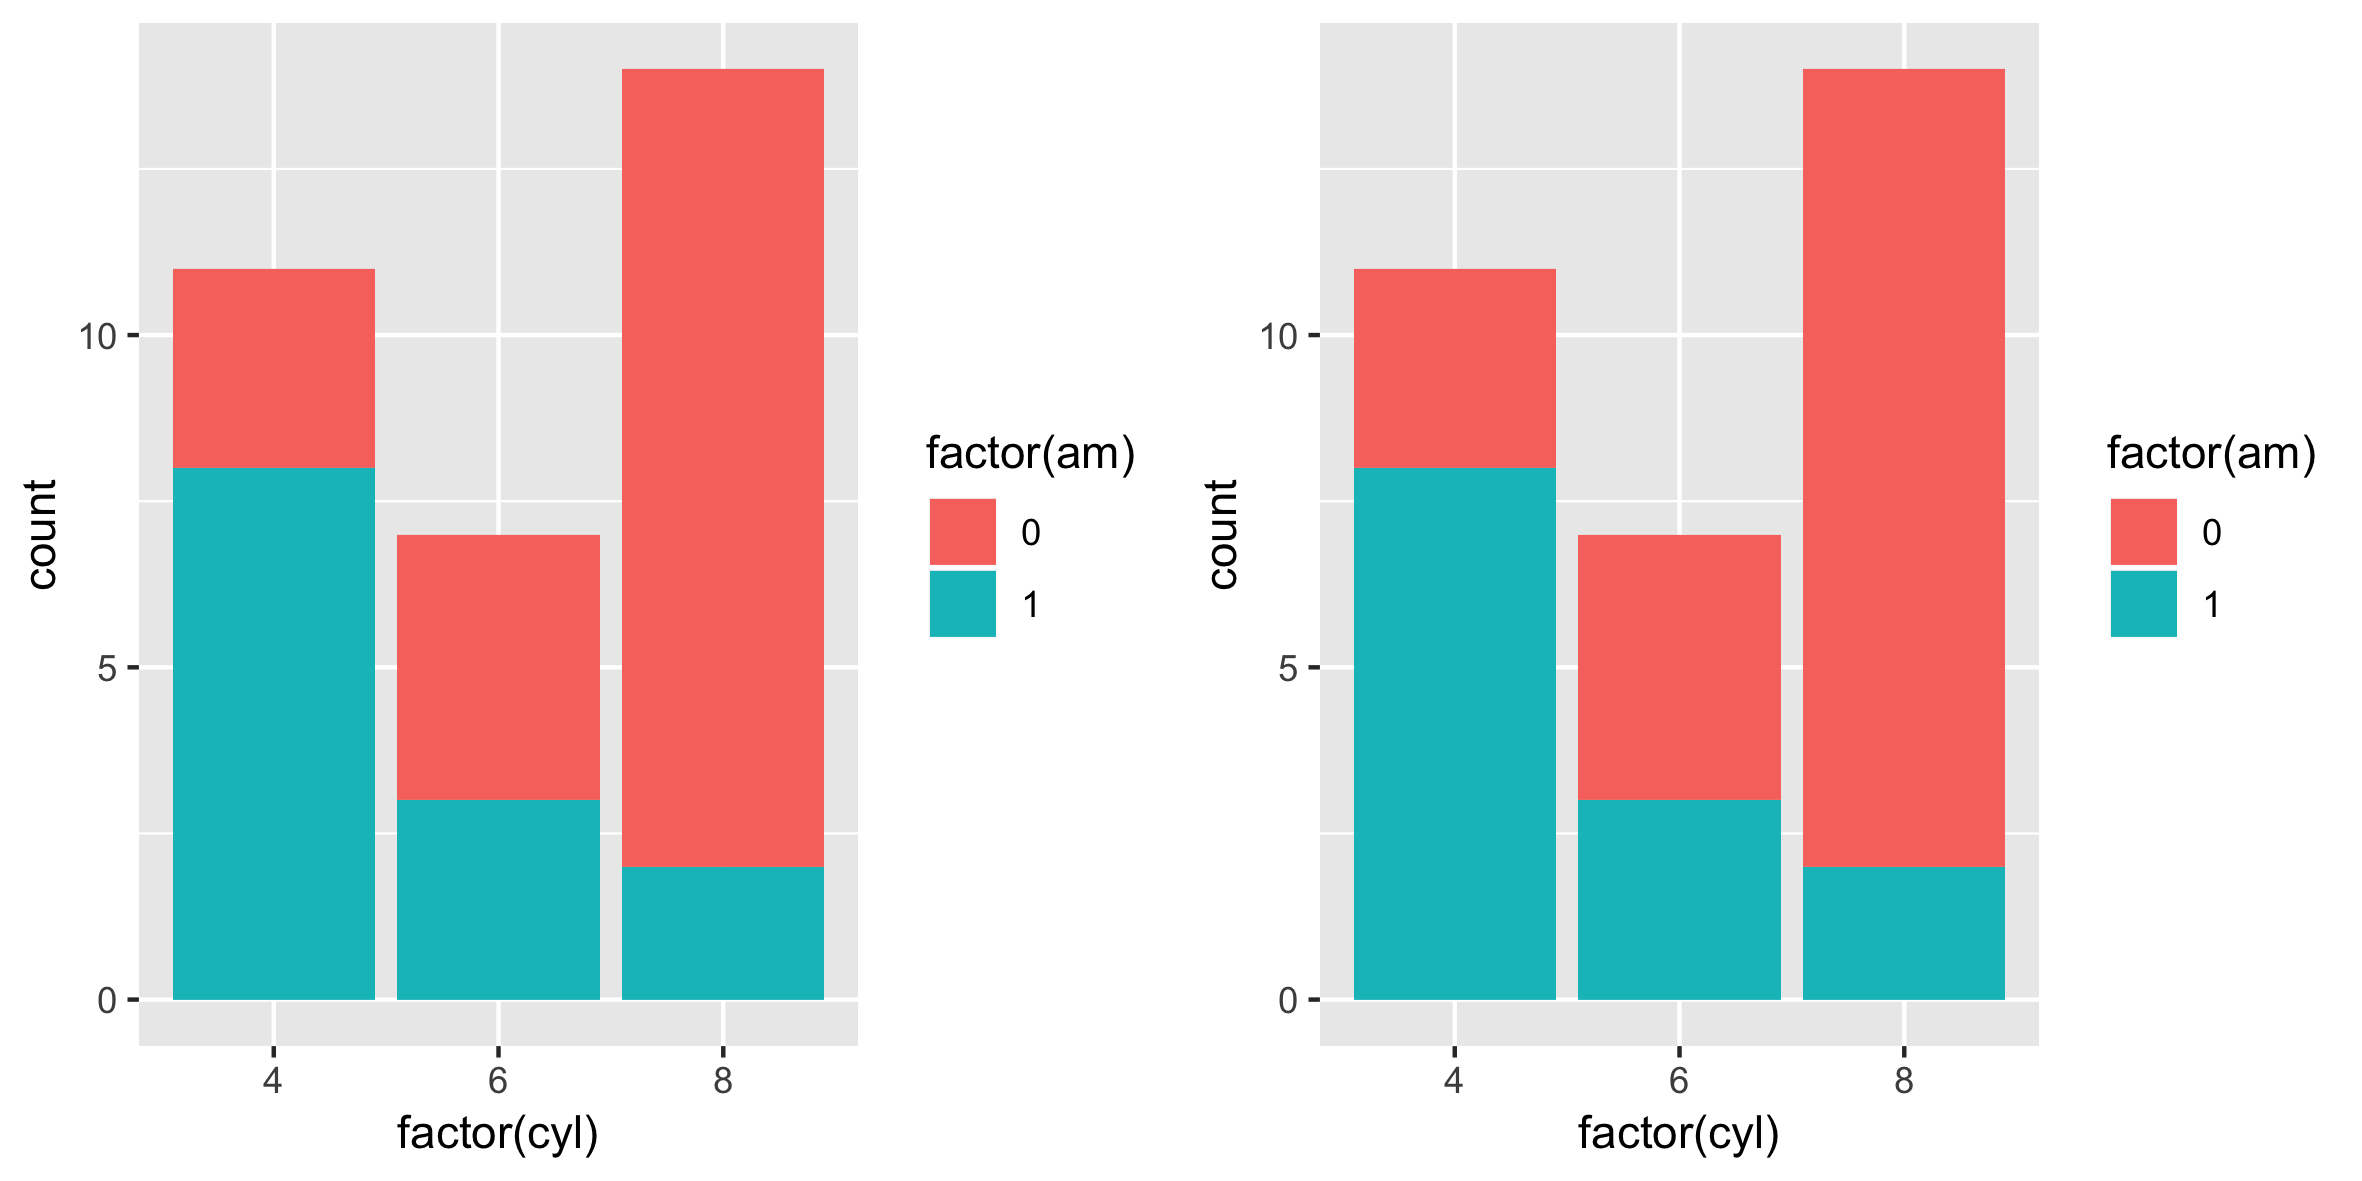
geom_ <-> stat_

p <- ggplot(mtcars, aes(x = factor(cyl),  fill = factor(am))) 
p + geom_bar()
p + stat_count()
Vizualizare intermediară a datelor cu ggplot2

Conexiunea geom_/stat_

stat_ geom_
stat_bin() geom_histogram(), geom_freqpoly()
stat_count() geom_bar()
Vizualizare intermediară a datelor cu ggplot2

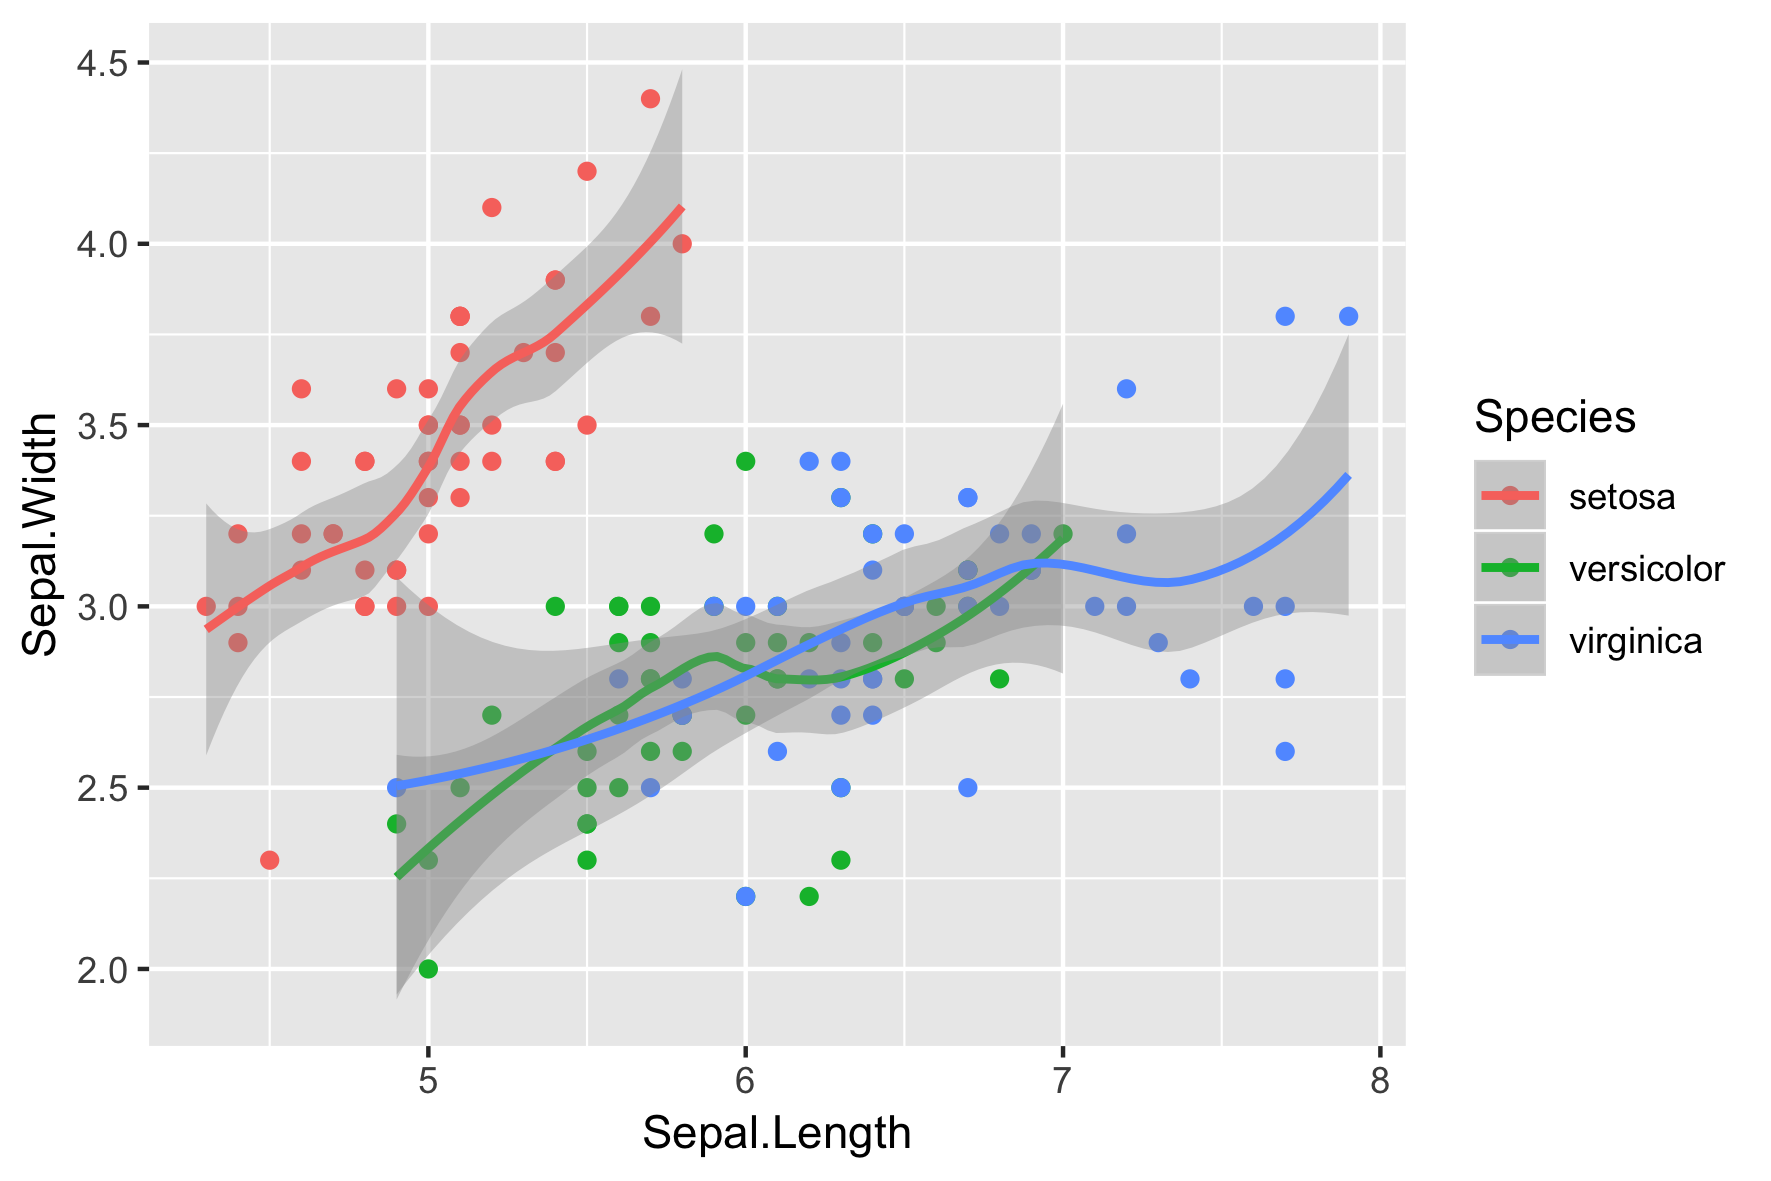
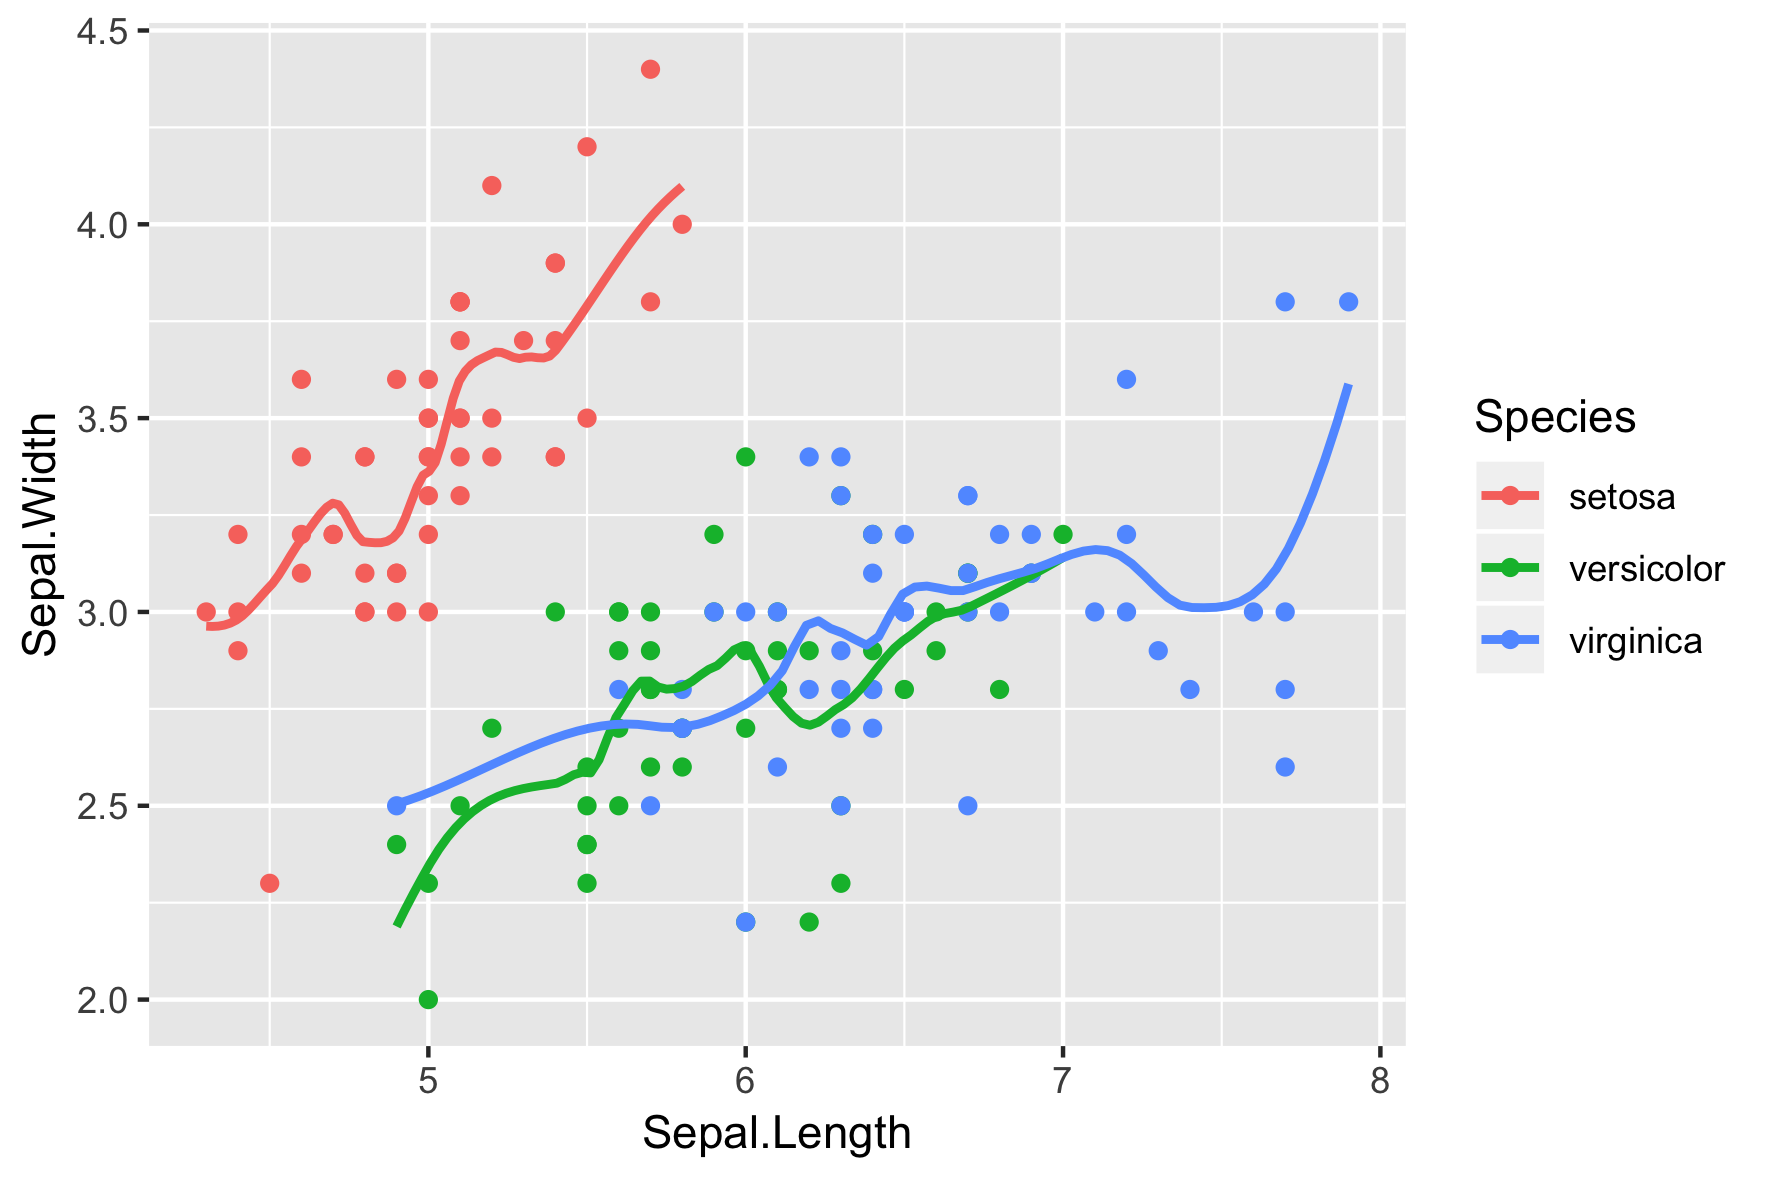
stat_smooth()

ggplot(iris, aes(x = Sepal.Length, 
                 y = Sepal.Width, 
                 color = Species)) + 
  geom_point() +
  geom_smooth()
geom_smooth() using method = 'loess' and 
formula 'y ~ x'

Vizualizare intermediară a datelor cu ggplot2

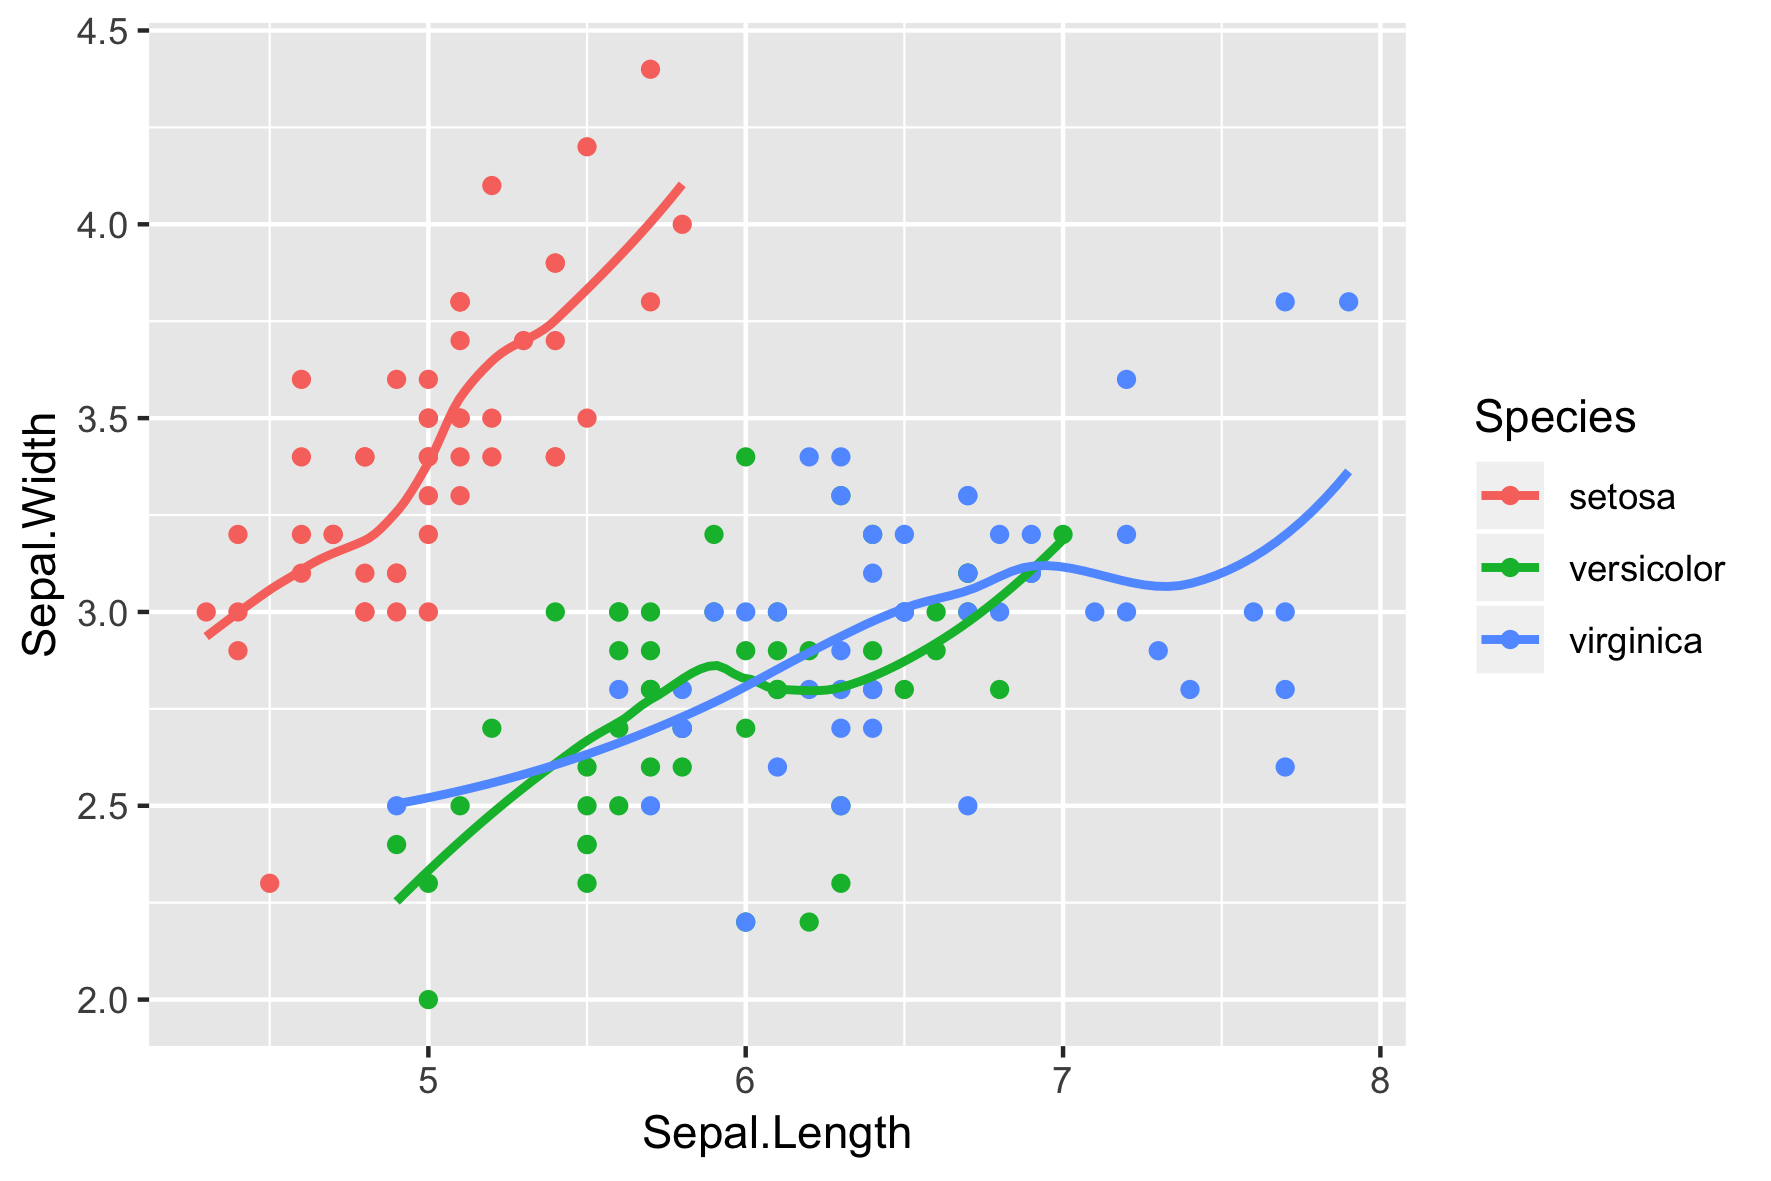
stat_smooth(se = FALSE)

ggplot(iris, aes(x = Sepal.Length, 
                 y = Sepal.Width, 
                 color = Species)) + 
  geom_point() +
  geom_smooth(se = FALSE)
geom_smooth() using method = 'loess' and 
formula 'y ~ x'

Vizualizare intermediară a datelor cu ggplot2

geom_smooth(span = 0.4)

ggplot(iris, aes(x = Sepal.Length, 
                 y = Sepal.Width, 
                 color = Species)) + 
  geom_point() +
  geom_smooth(se = FALSE, span = 0.4)
geom_smooth() using method = 'loess' and 
formula 'y ~ x'

Vizualizare intermediară a datelor cu ggplot2

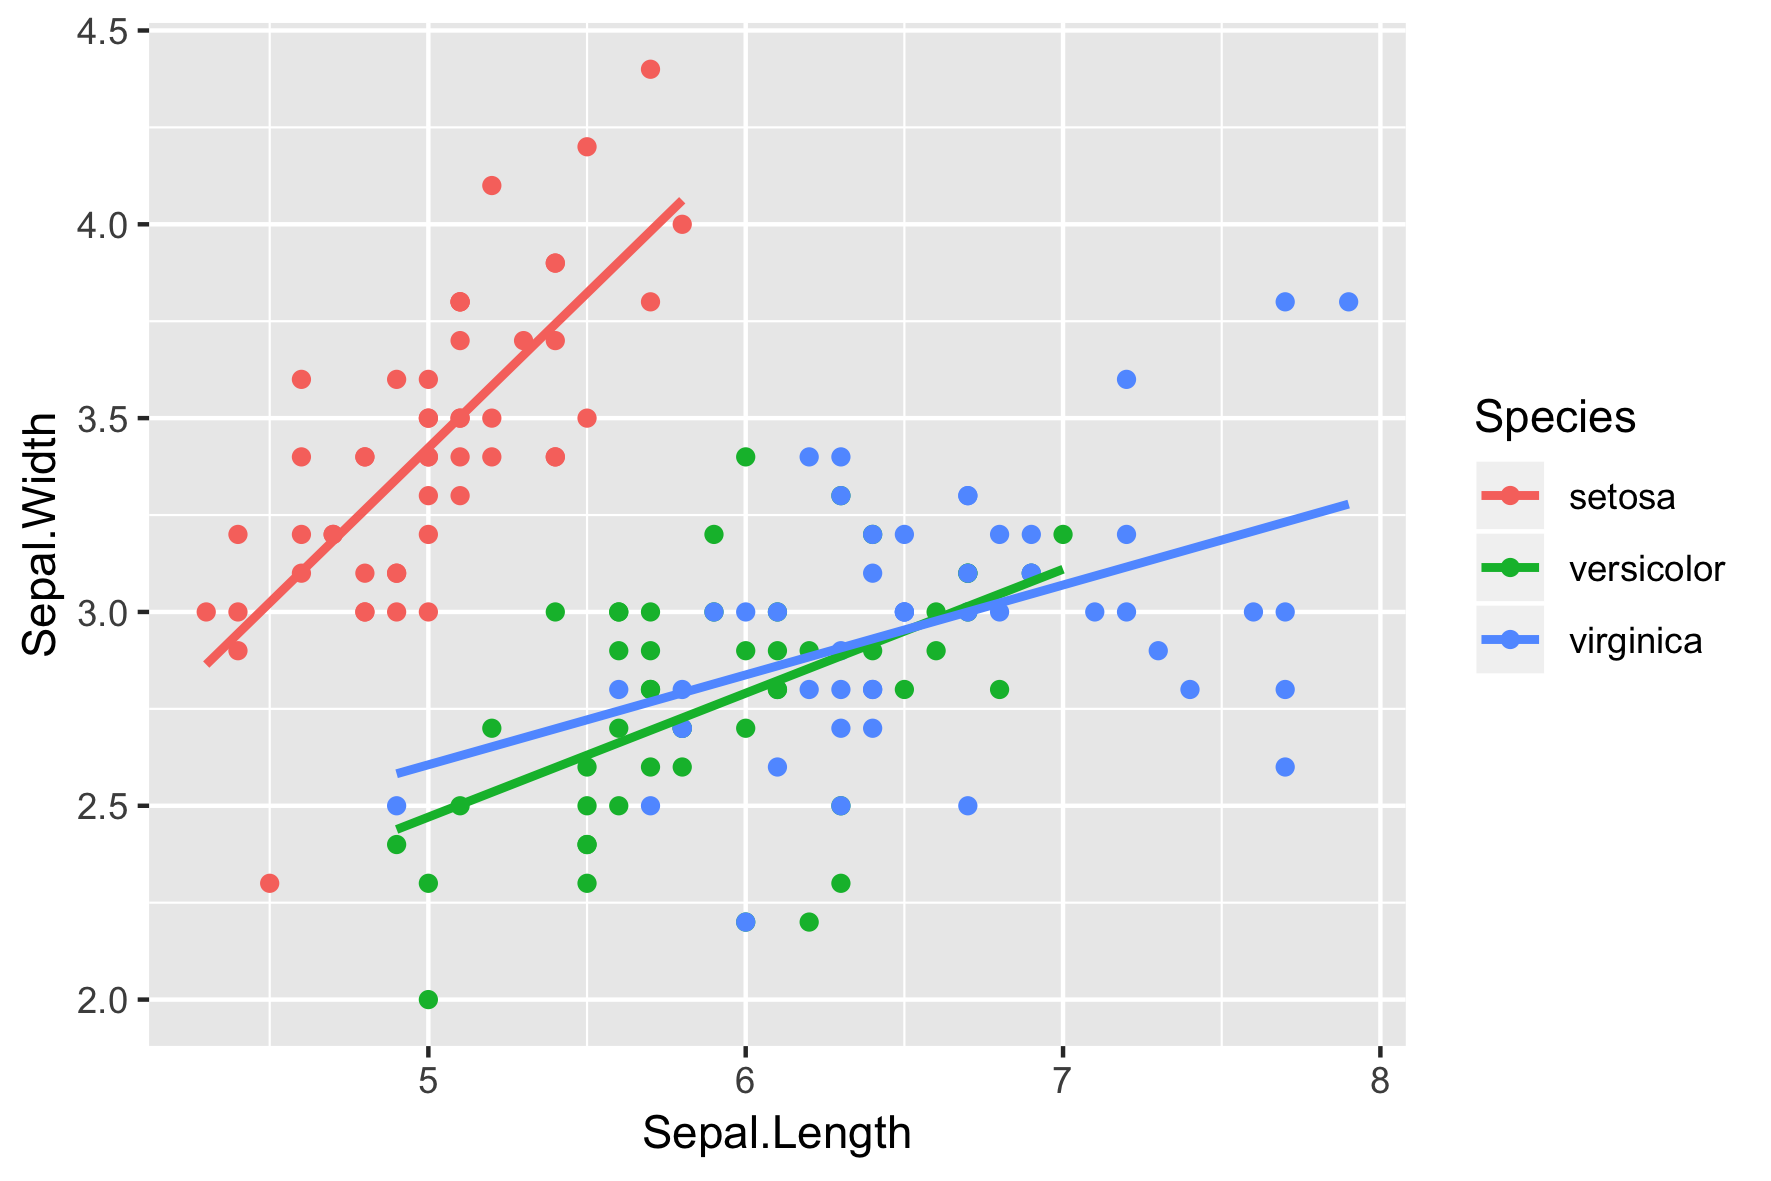
geom_smooth(method = "lm")

ggplot(iris, aes(x = Sepal.Length, 
                 y = Sepal.Width, 
                 color = Species)) + 
  geom_point() +
  geom_smooth(method = "lm", se = FALSE)

Vizualizare intermediară a datelor cu ggplot2

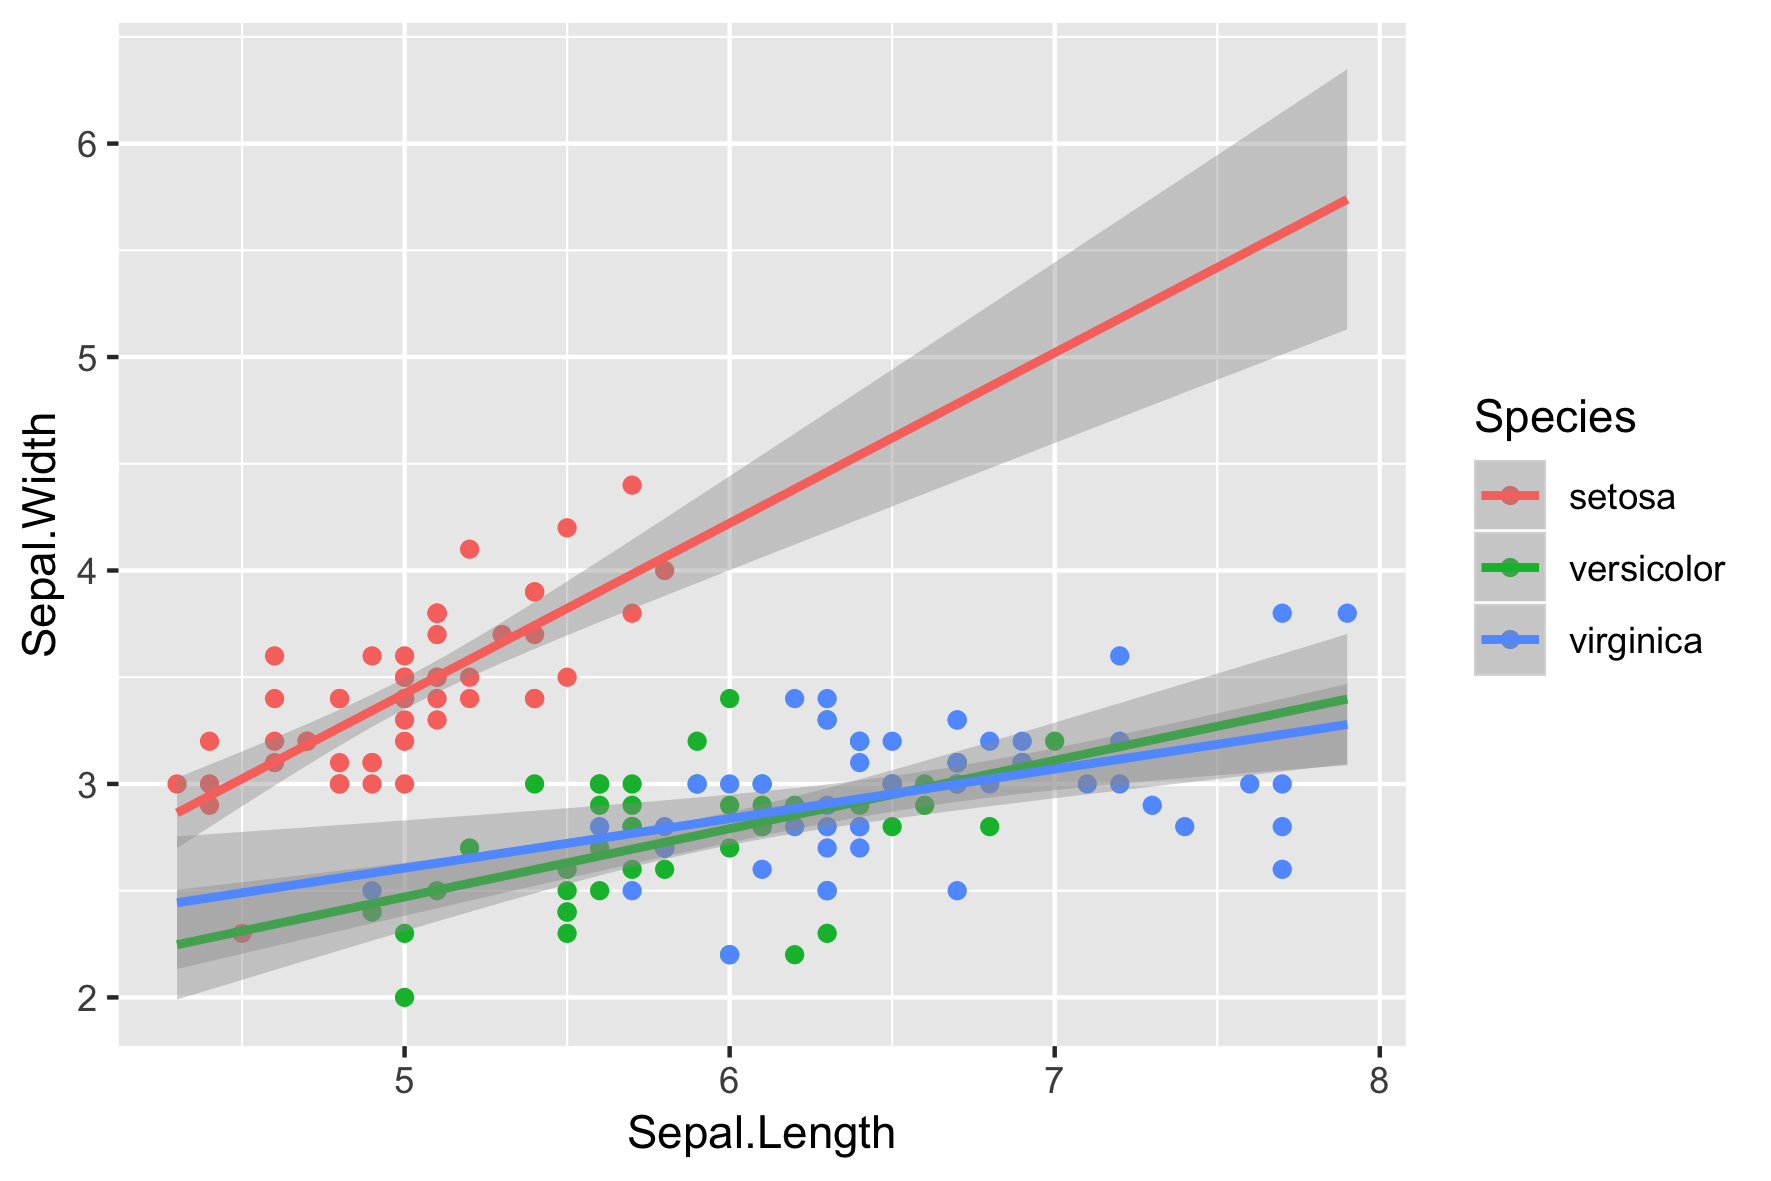
geom_smooth(fullrange = TRUE)

ggplot(iris, aes(x = Sepal.Length, 
                 y = Sepal.Width, 
                 color = Species)) + 
  geom_point() +
  geom_smooth(method = "lm", 
              fullrange = TRUE)

Vizualizare intermediară a datelor cu ggplot2

Conexiunea geom_/stat_

stat_ geom_
stat_bin() geom_histogram(), geom_freqpoly()
stat_count() geom_bar()
stat_smooth() geom_smooth()
Vizualizare intermediară a datelor cu ggplot2

Alte funcții stat_

stat_ geom_
stat_boxplot() geom_boxplot()
Vizualizare intermediară a datelor cu ggplot2

Alte funcții stat_

stat_ geom_
stat_boxplot() geom_boxplot()
stat_bindot() geom_dotplot()
stat_bin2d() geom_bin2d()
stat_binhex() geom_hex()
Vizualizare intermediară a datelor cu ggplot2

Alte funcții stat_

stat_ geom_
stat_boxplot() geom_boxplot()
stat_bindot() geom_dotplot()
stat_bin2d() geom_bin2d()
stat_binhex() geom_hex()
stat_contour() geom_contour()
stat_quantile() geom_quantile()
stat_sum() geom_count()
Vizualizare intermediară a datelor cu ggplot2

Să exersăm!

Vizualizare intermediară a datelor cu ggplot2

Preparing Video For Download...