Spații de reprezentare pentru fațete

Vizualizare intermediară a datelor cu ggplot2

Rick Scavetta

Founder, Scavetta Academy

Fațete și spații de reprezentare

Motive pentru a nu folosi spații uniforme de reprezentare:

Tip variabilă Subseturile conțin
Continuă Intervale foarte diferite
Categorială Grupuri diferite
Vizualizare intermediară a datelor cu ggplot2

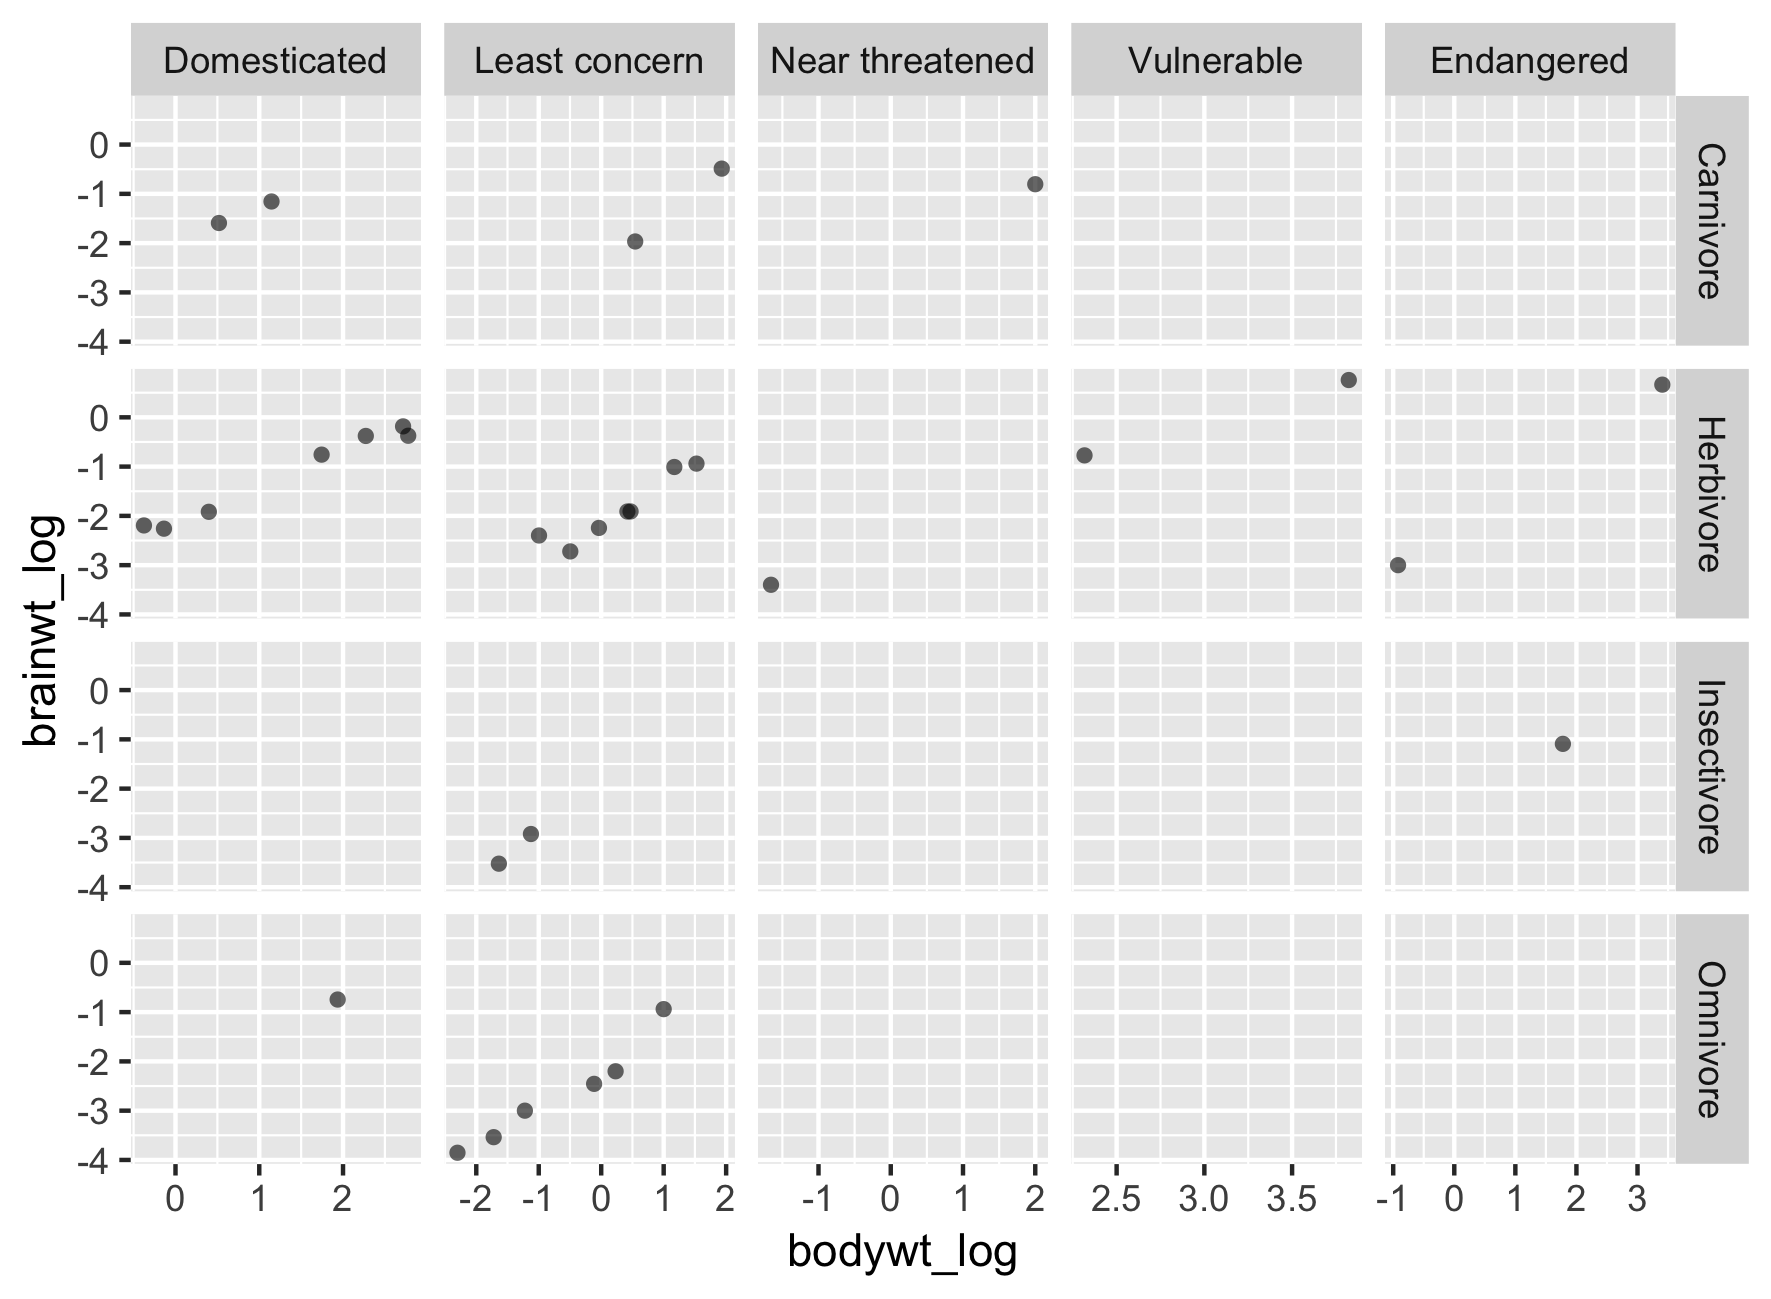
Ajustarea spațiului de reprezentare...
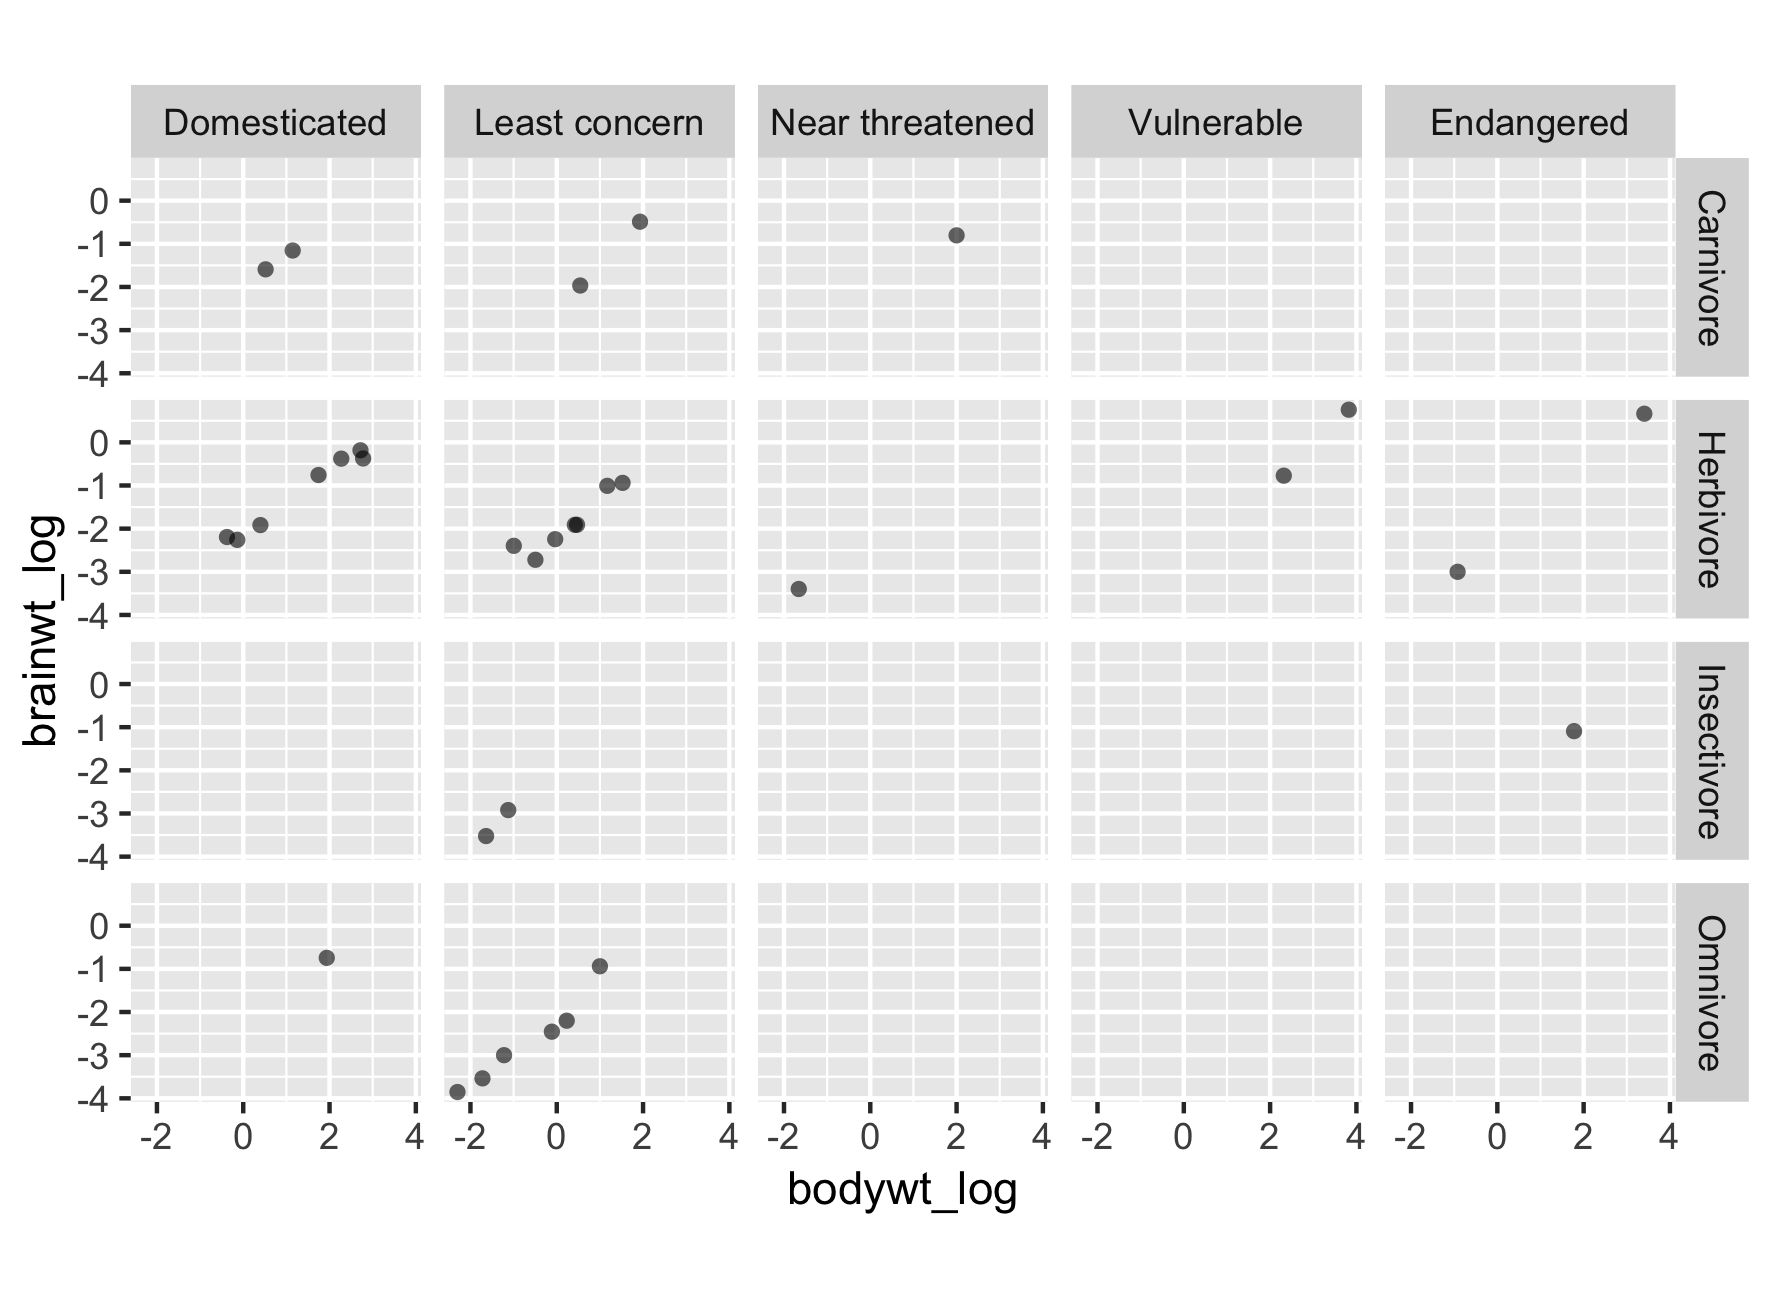
ggplot(msleep2, aes(bodywt_log,
                    brainwt_log)) +
  geom_point(alpha = 0.6, shape = 16) +
  coord_fixed() +
  facet_grid(rows = vars(vore), 
             cols = vars(conservation))

Vizualizare intermediară a datelor cu ggplot2

... dar nu cu scale fixe

ggplot(msleep2, aes(bodywt_log,
                         brainwt_log)) +
  geom_point(alpha = 0.6, shape = 16) +
  coord_fixed() +
  facet_grid(rows = vars(vore), 
             cols = vars(conservation),
             scales = "free_x")
Error: coord_fixed doesn't support free scales
Vizualizare intermediară a datelor cu ggplot2

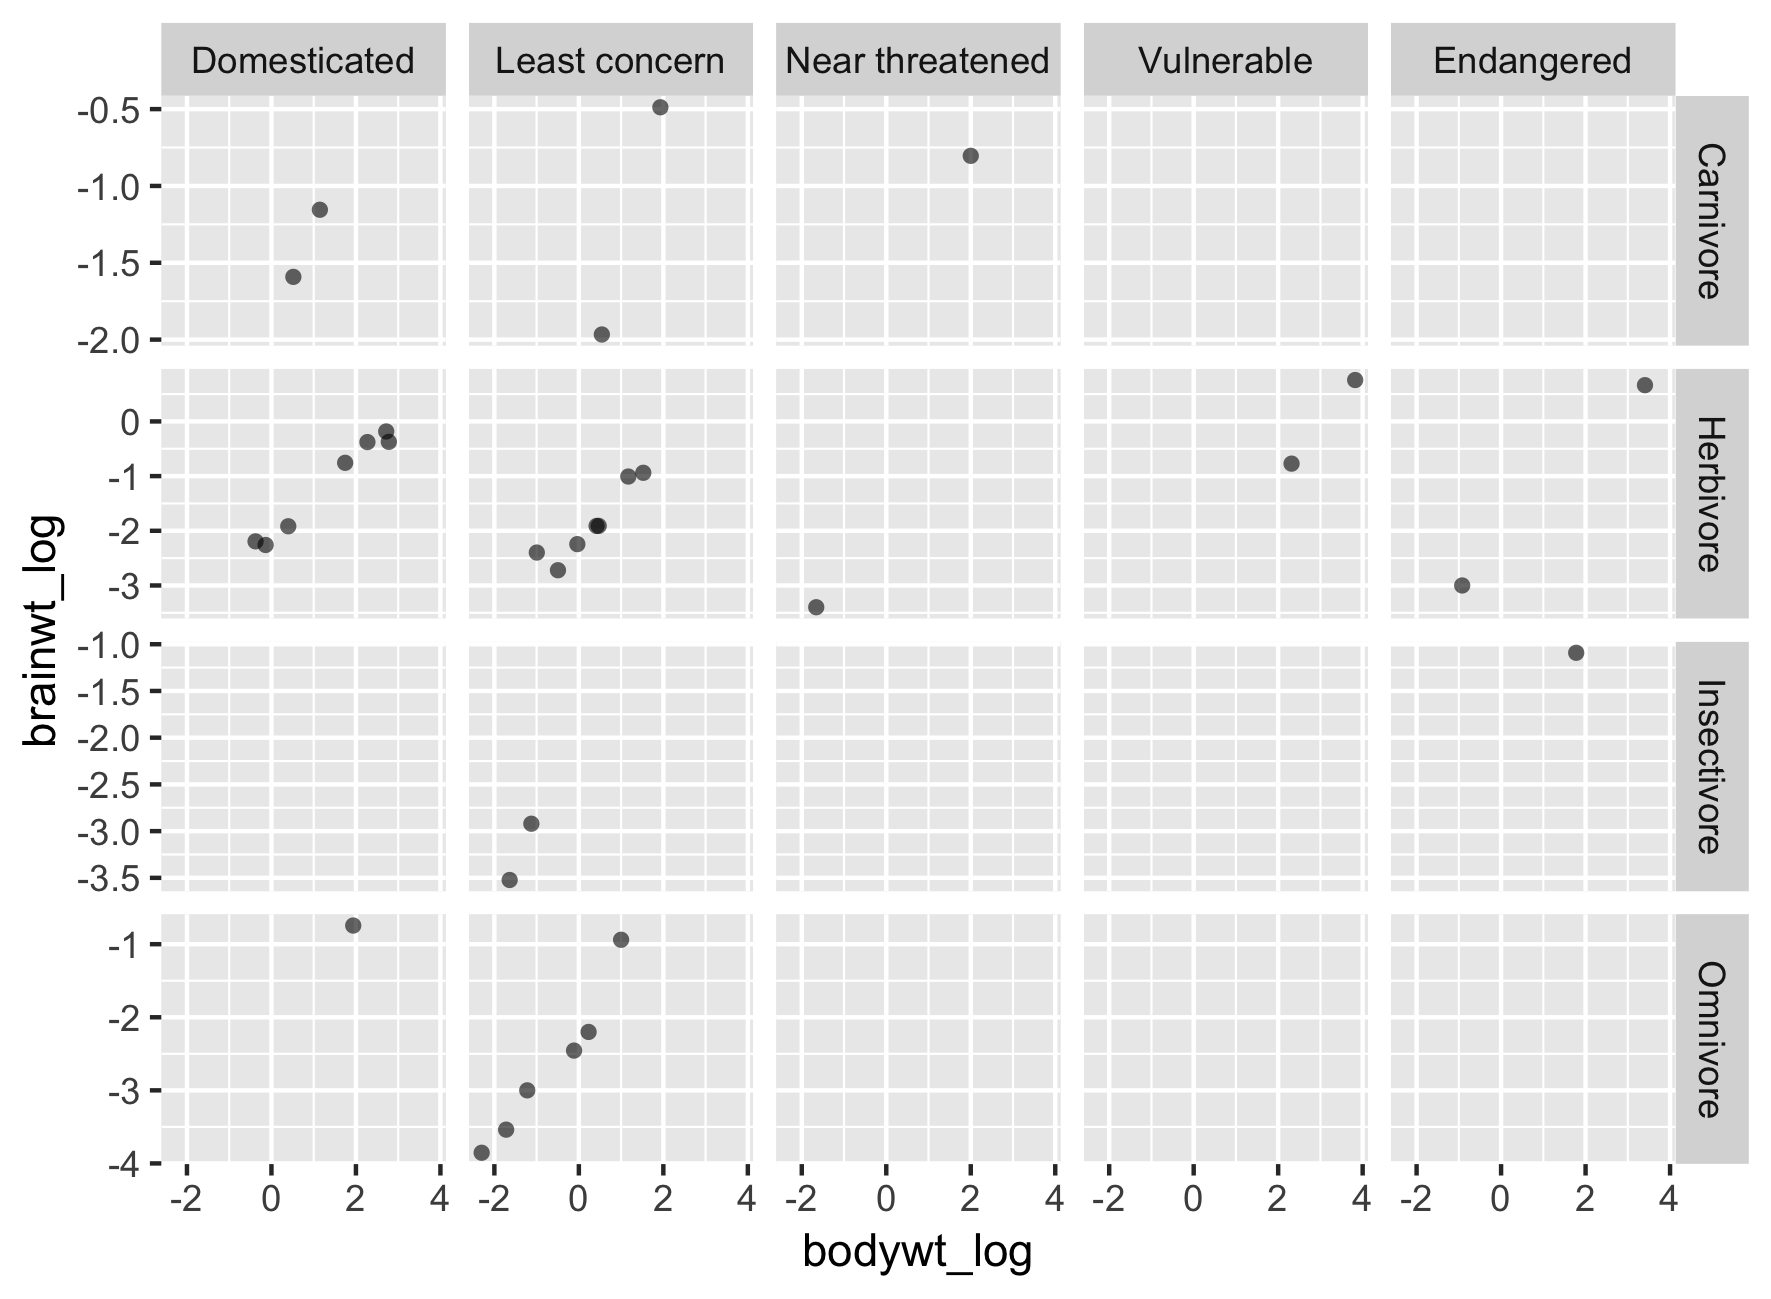
Ajustarea spațiului de reprezentare

ggplot(msleep2, aes(bodywt_log, 
                    brainwt_log)) +
  geom_point(alpha = 0.6, shape = 16) +
  facet_grid(rows = vars(vore), 
             cols = vars(conservation),
             scales = "free_x") 

Vizualizare intermediară a datelor cu ggplot2

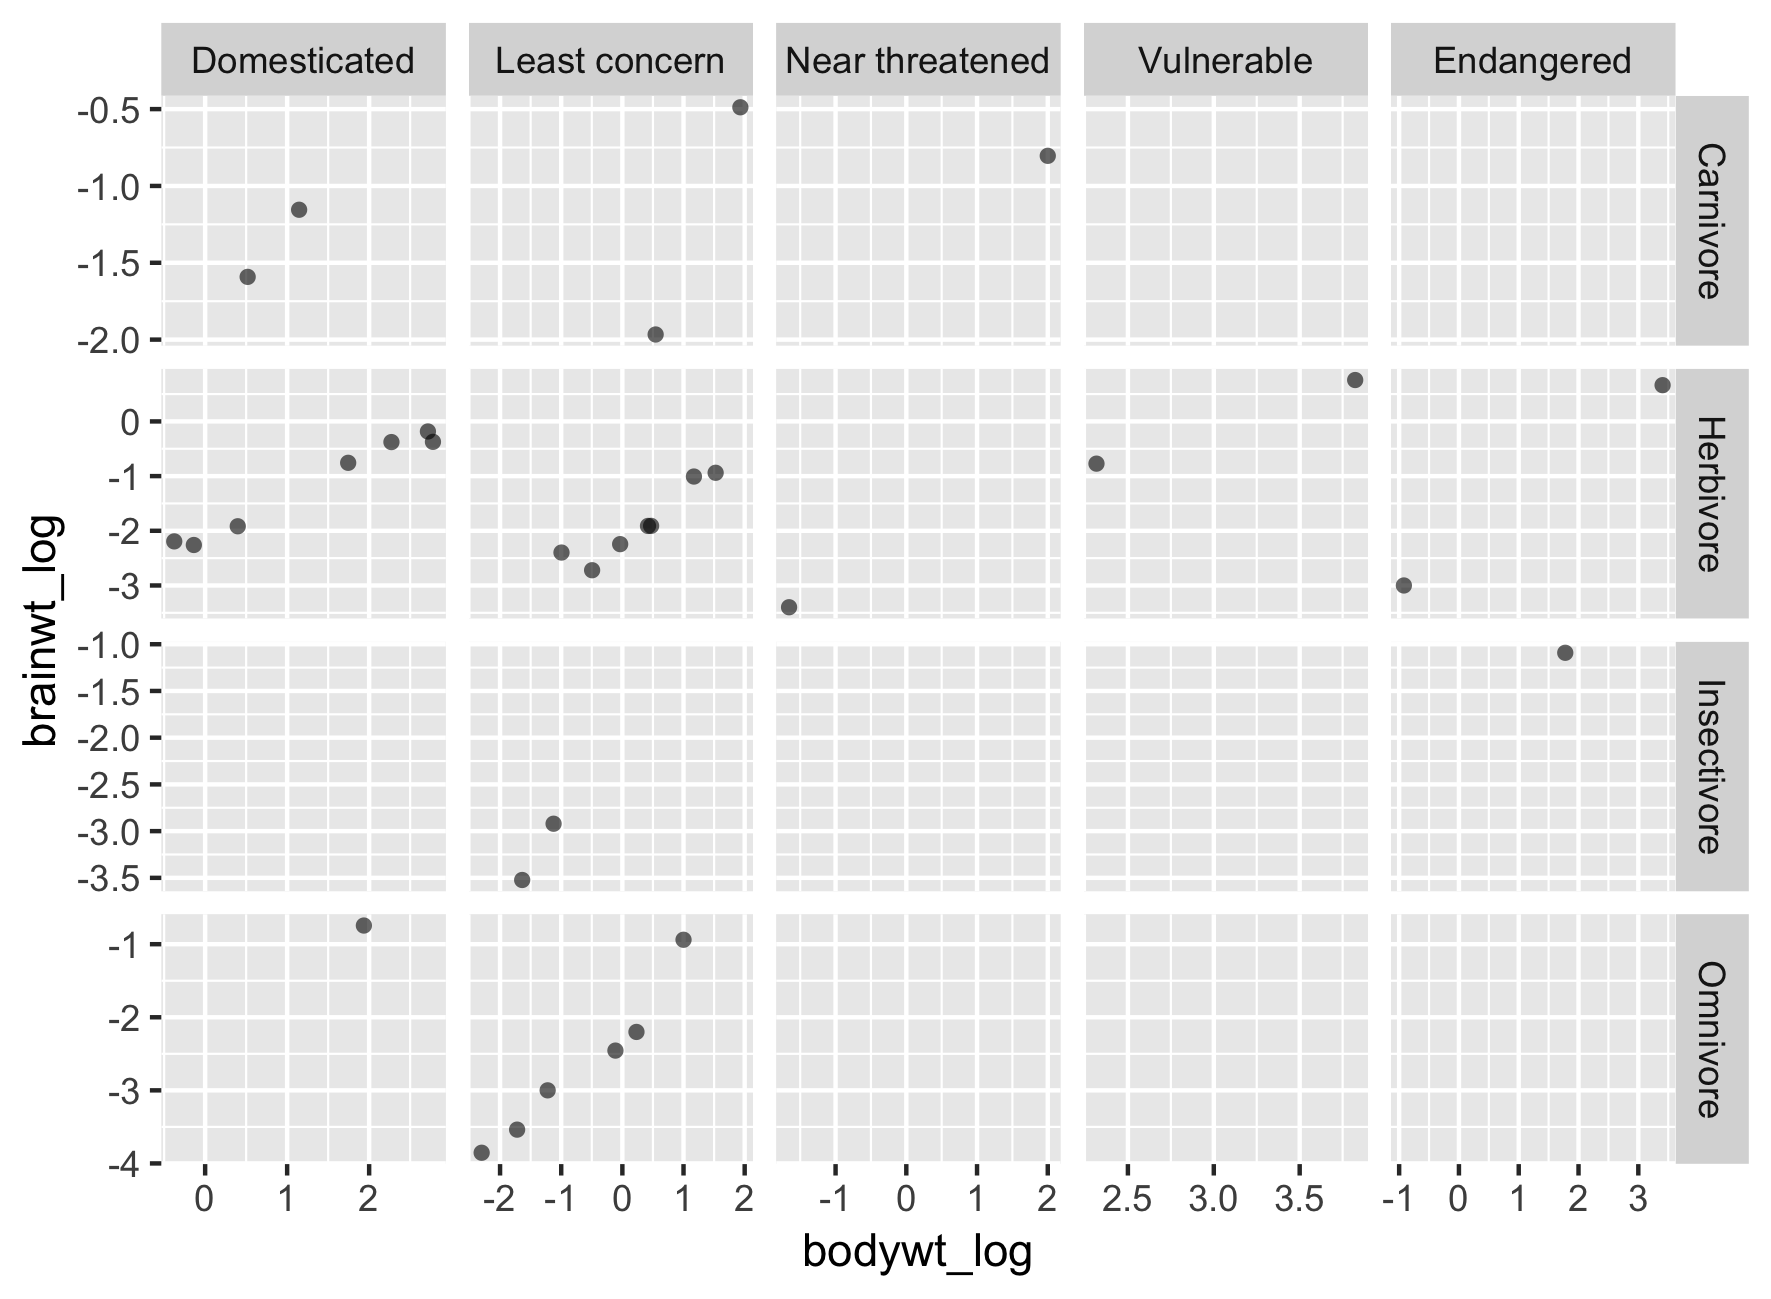
Ajustarea spațiului de reprezentare

ggplot(msleep2, aes(bodywt_log, 
                    brainwt_log)) +
  geom_point(alpha = 0.6, shape = 16) +
  facet_grid(rows = vars(vore), 
             cols = vars(conservation),
             scales = "free_y") 

Vizualizare intermediară a datelor cu ggplot2

Ajustarea spațiului de reprezentare

ggplot(msleep2, aes(bodywt_log, 
                    brainwt_log)) +
  geom_point(alpha = 0.6, shape = 16) +
  facet_grid(rows = vars(vore), 
             cols = vars(conservation),
             scales = "free") 

Vizualizare intermediară a datelor cu ggplot2

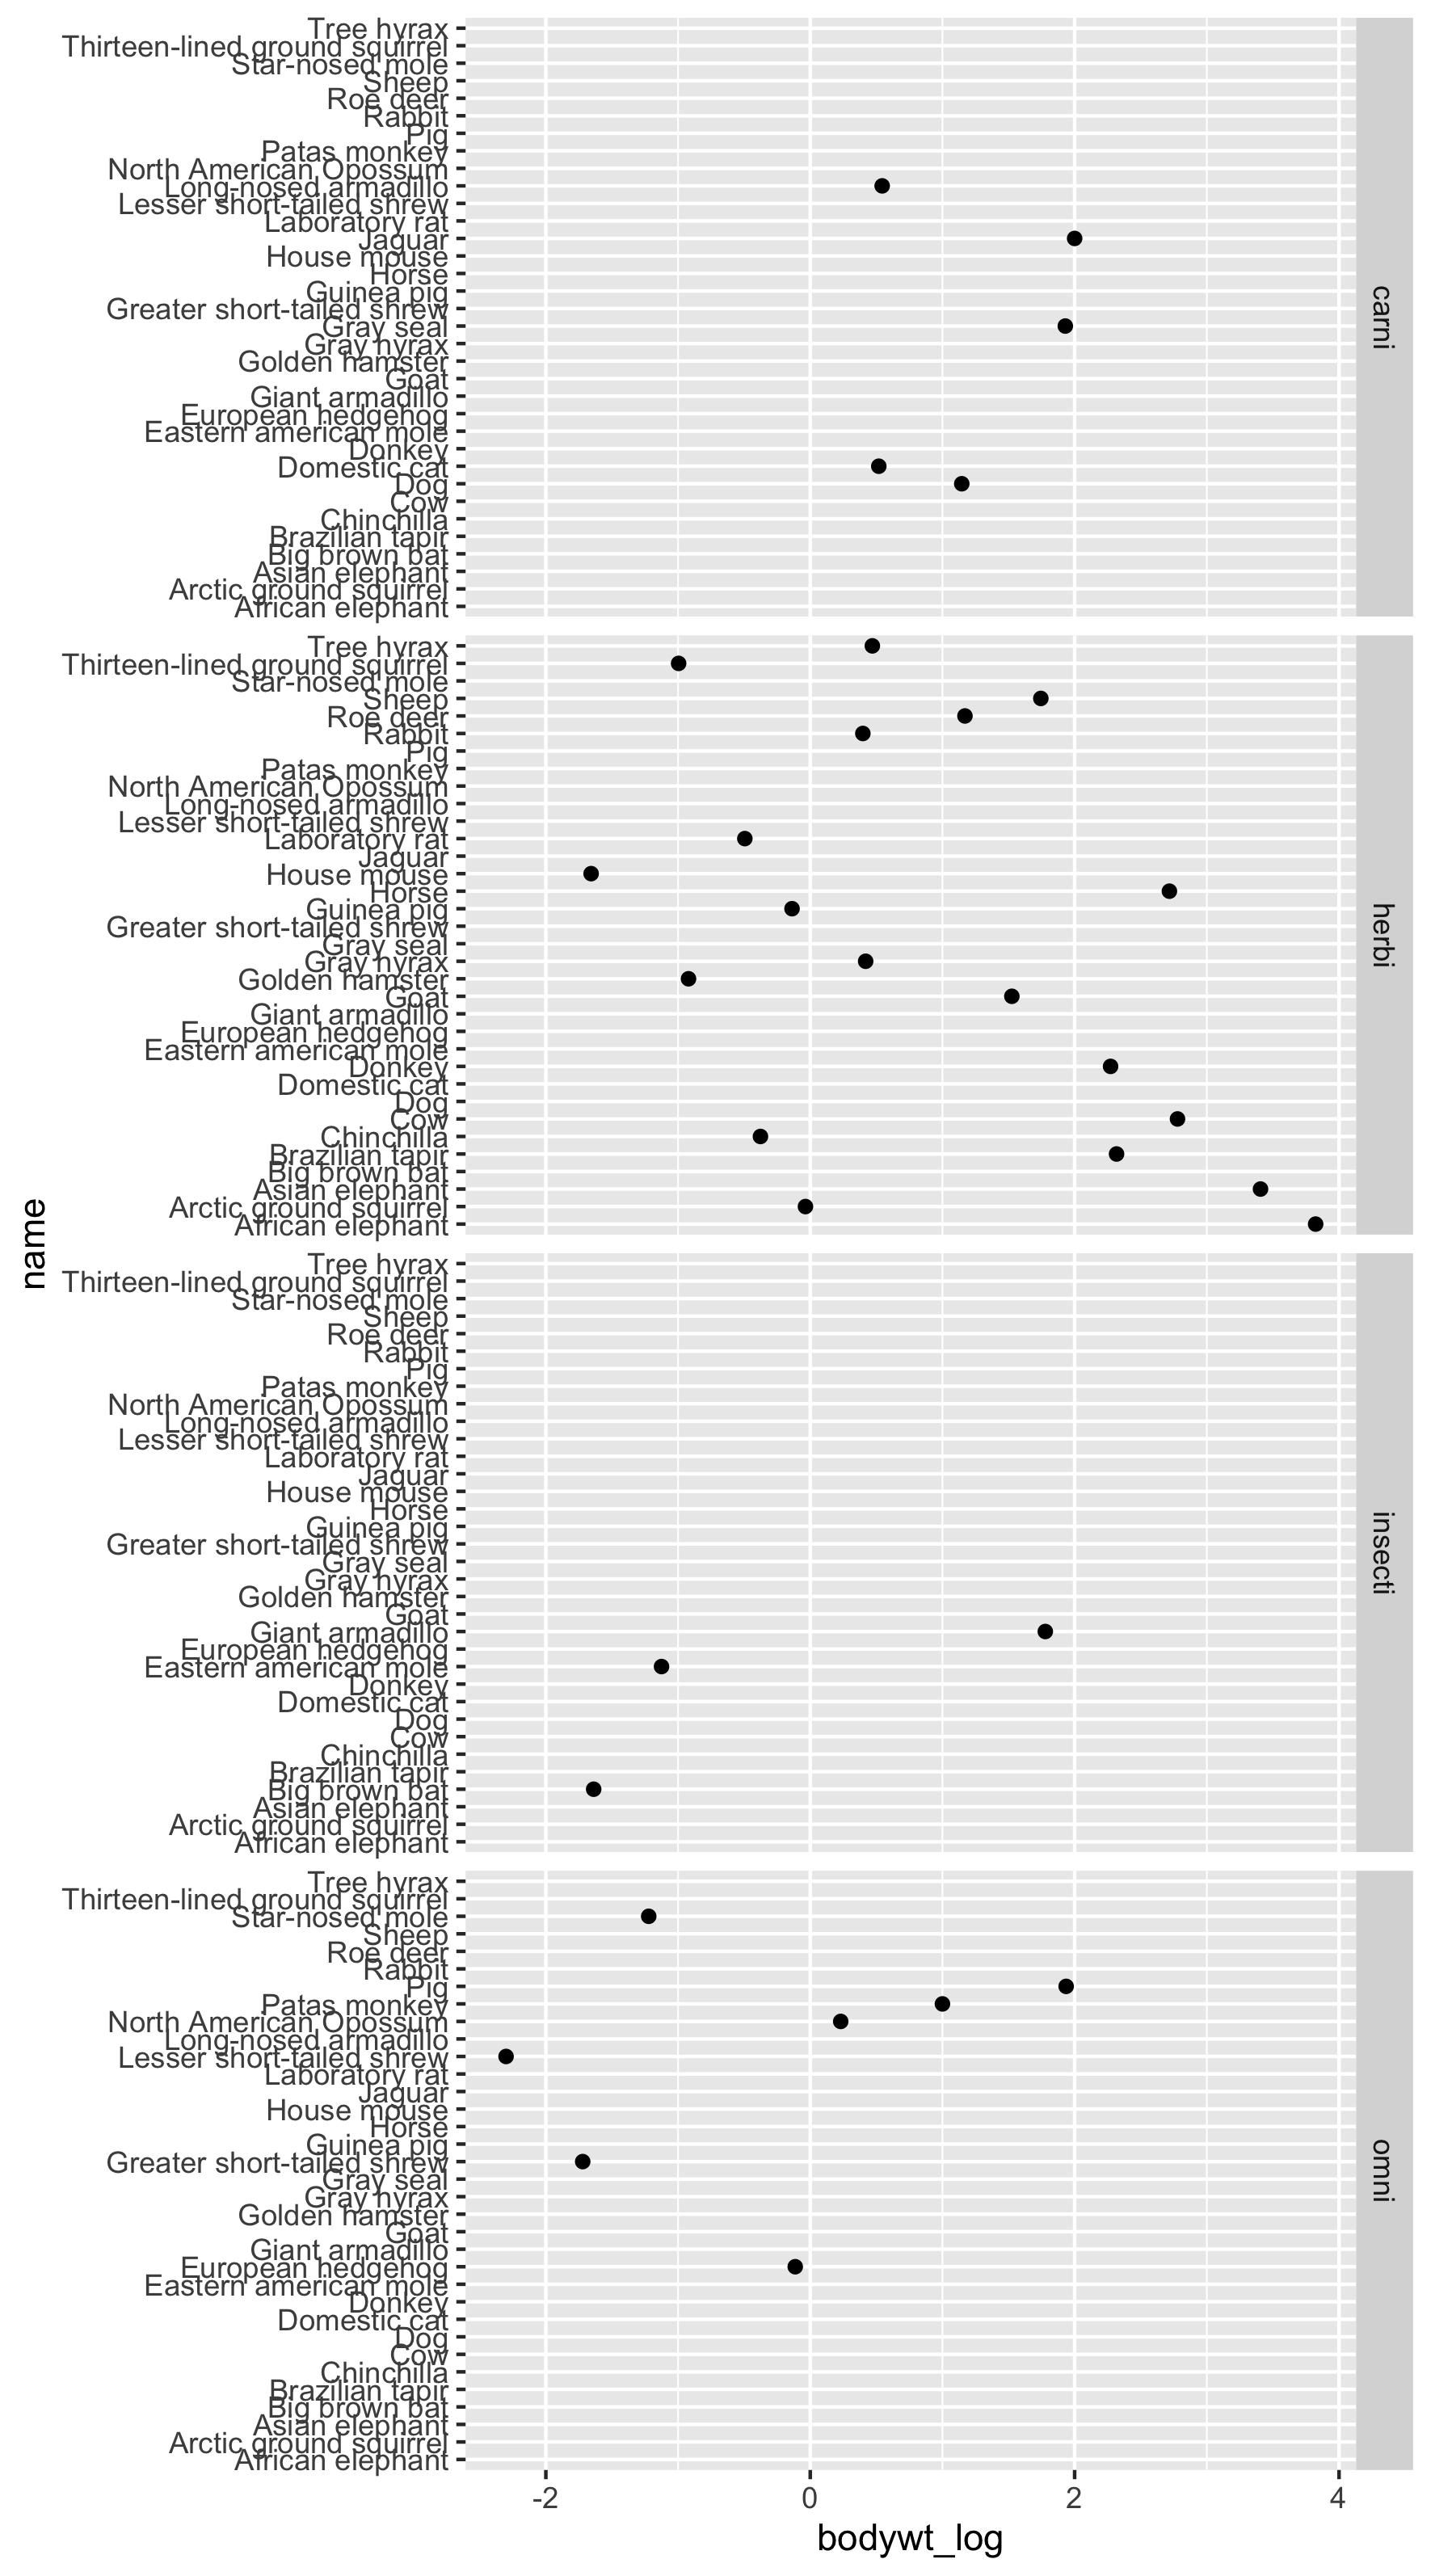
Ajustarea spațiului de reprezentare

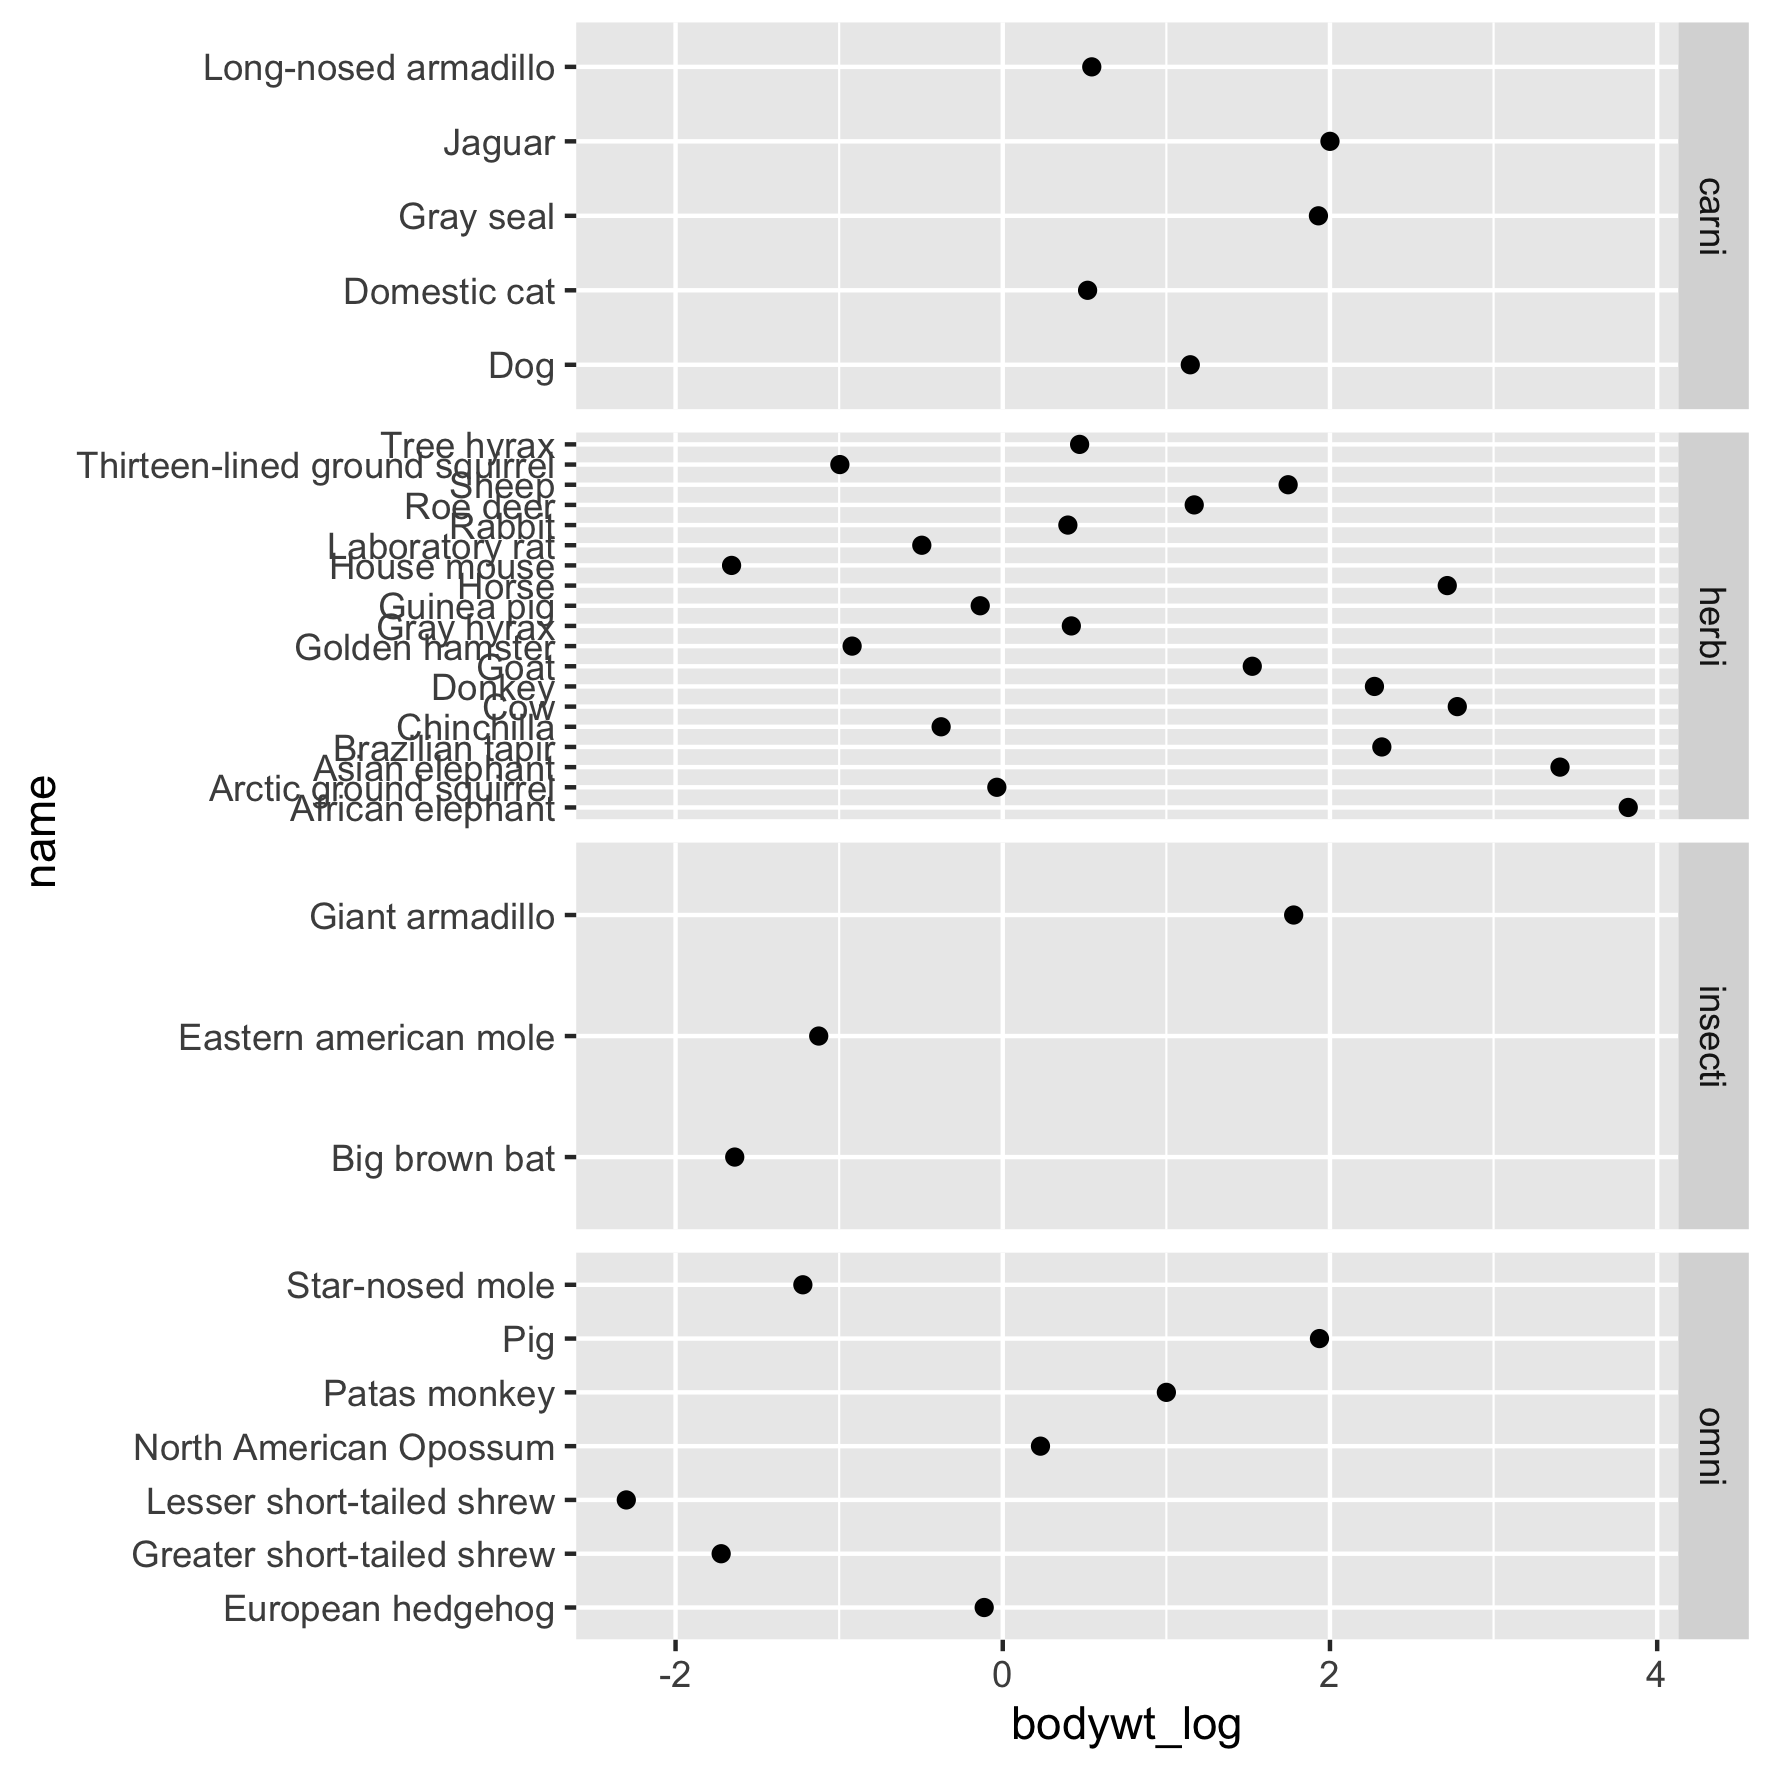
ggplot(msleep2, aes(x = bodywt_log, 
                    y = name)) +
  geom_point() +
  facet_grid(rows = vars(vore))

Vizualizare intermediară a datelor cu ggplot2

Ajustarea spațiului de reprezentare

ggplot(msleep2, aes(x = bodywt_log, 
                    y = name)) +
  geom_point() +
  # Free the y scales and space
  facet_grid(rows = vars(vore), 
             scales = "free_y")

Vizualizare intermediară a datelor cu ggplot2

Ajustarea spațiului de reprezentare

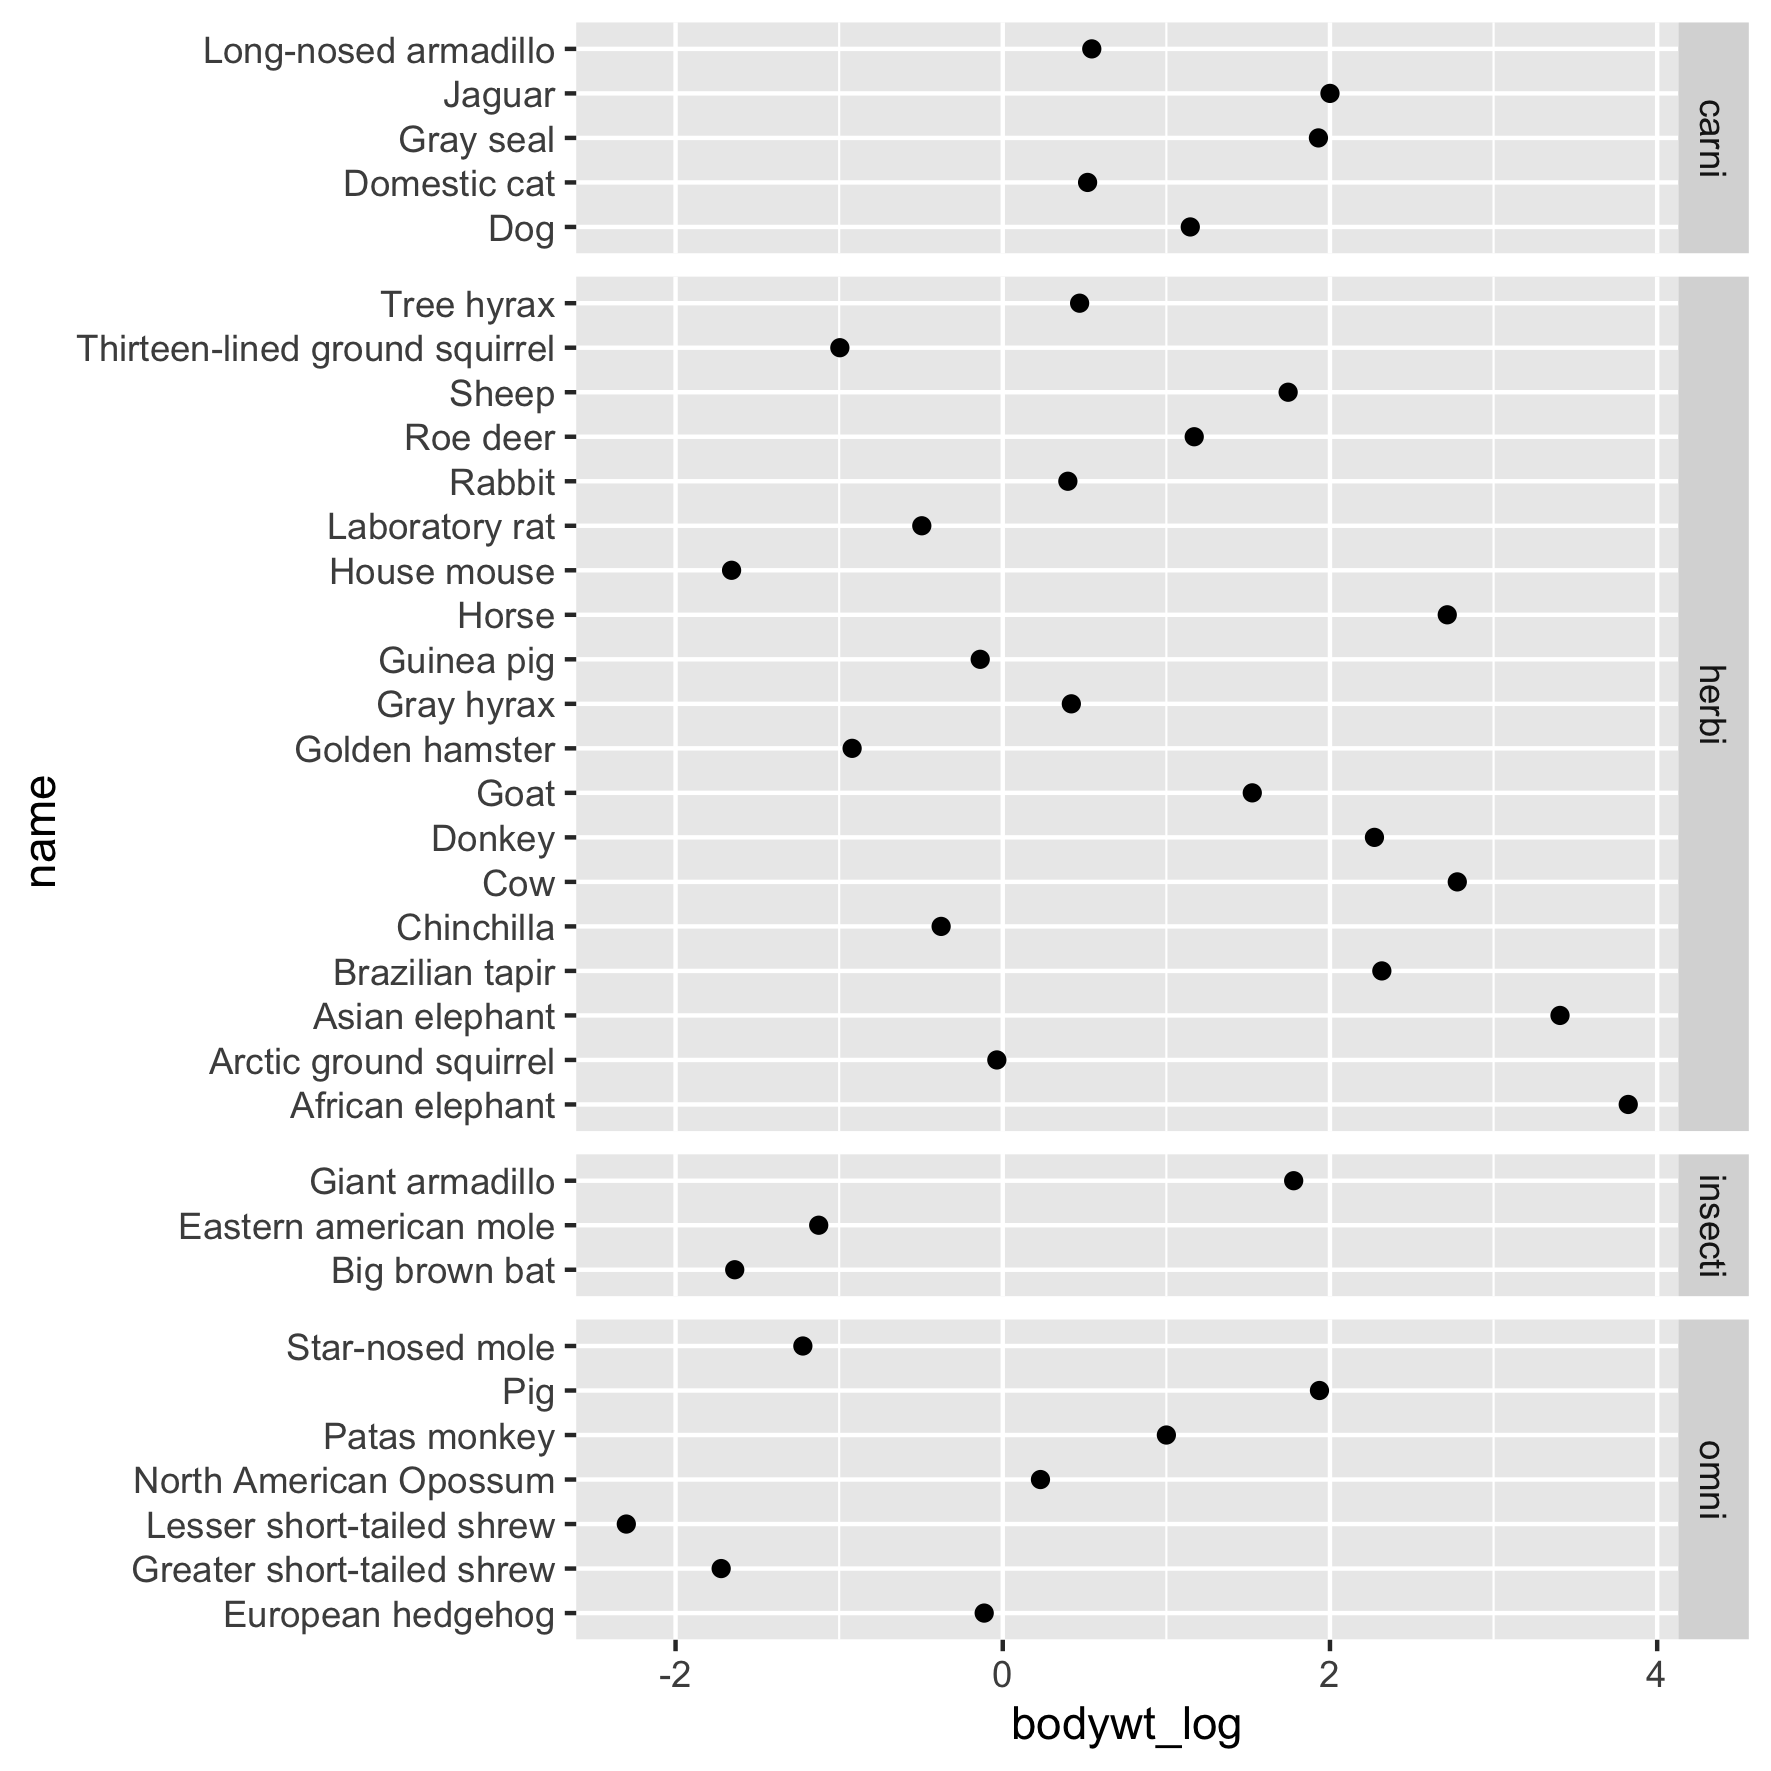
ggplot(msleep2, aes(x = bodywt_log, 
                    y = name)) +
  geom_point() +
  # Free the y scales and space
  facet_grid(rows = vars(vore),
             scales = "free_y", 
             space = "free_y")

Vizualizare intermediară a datelor cu ggplot2

Ajustări finale

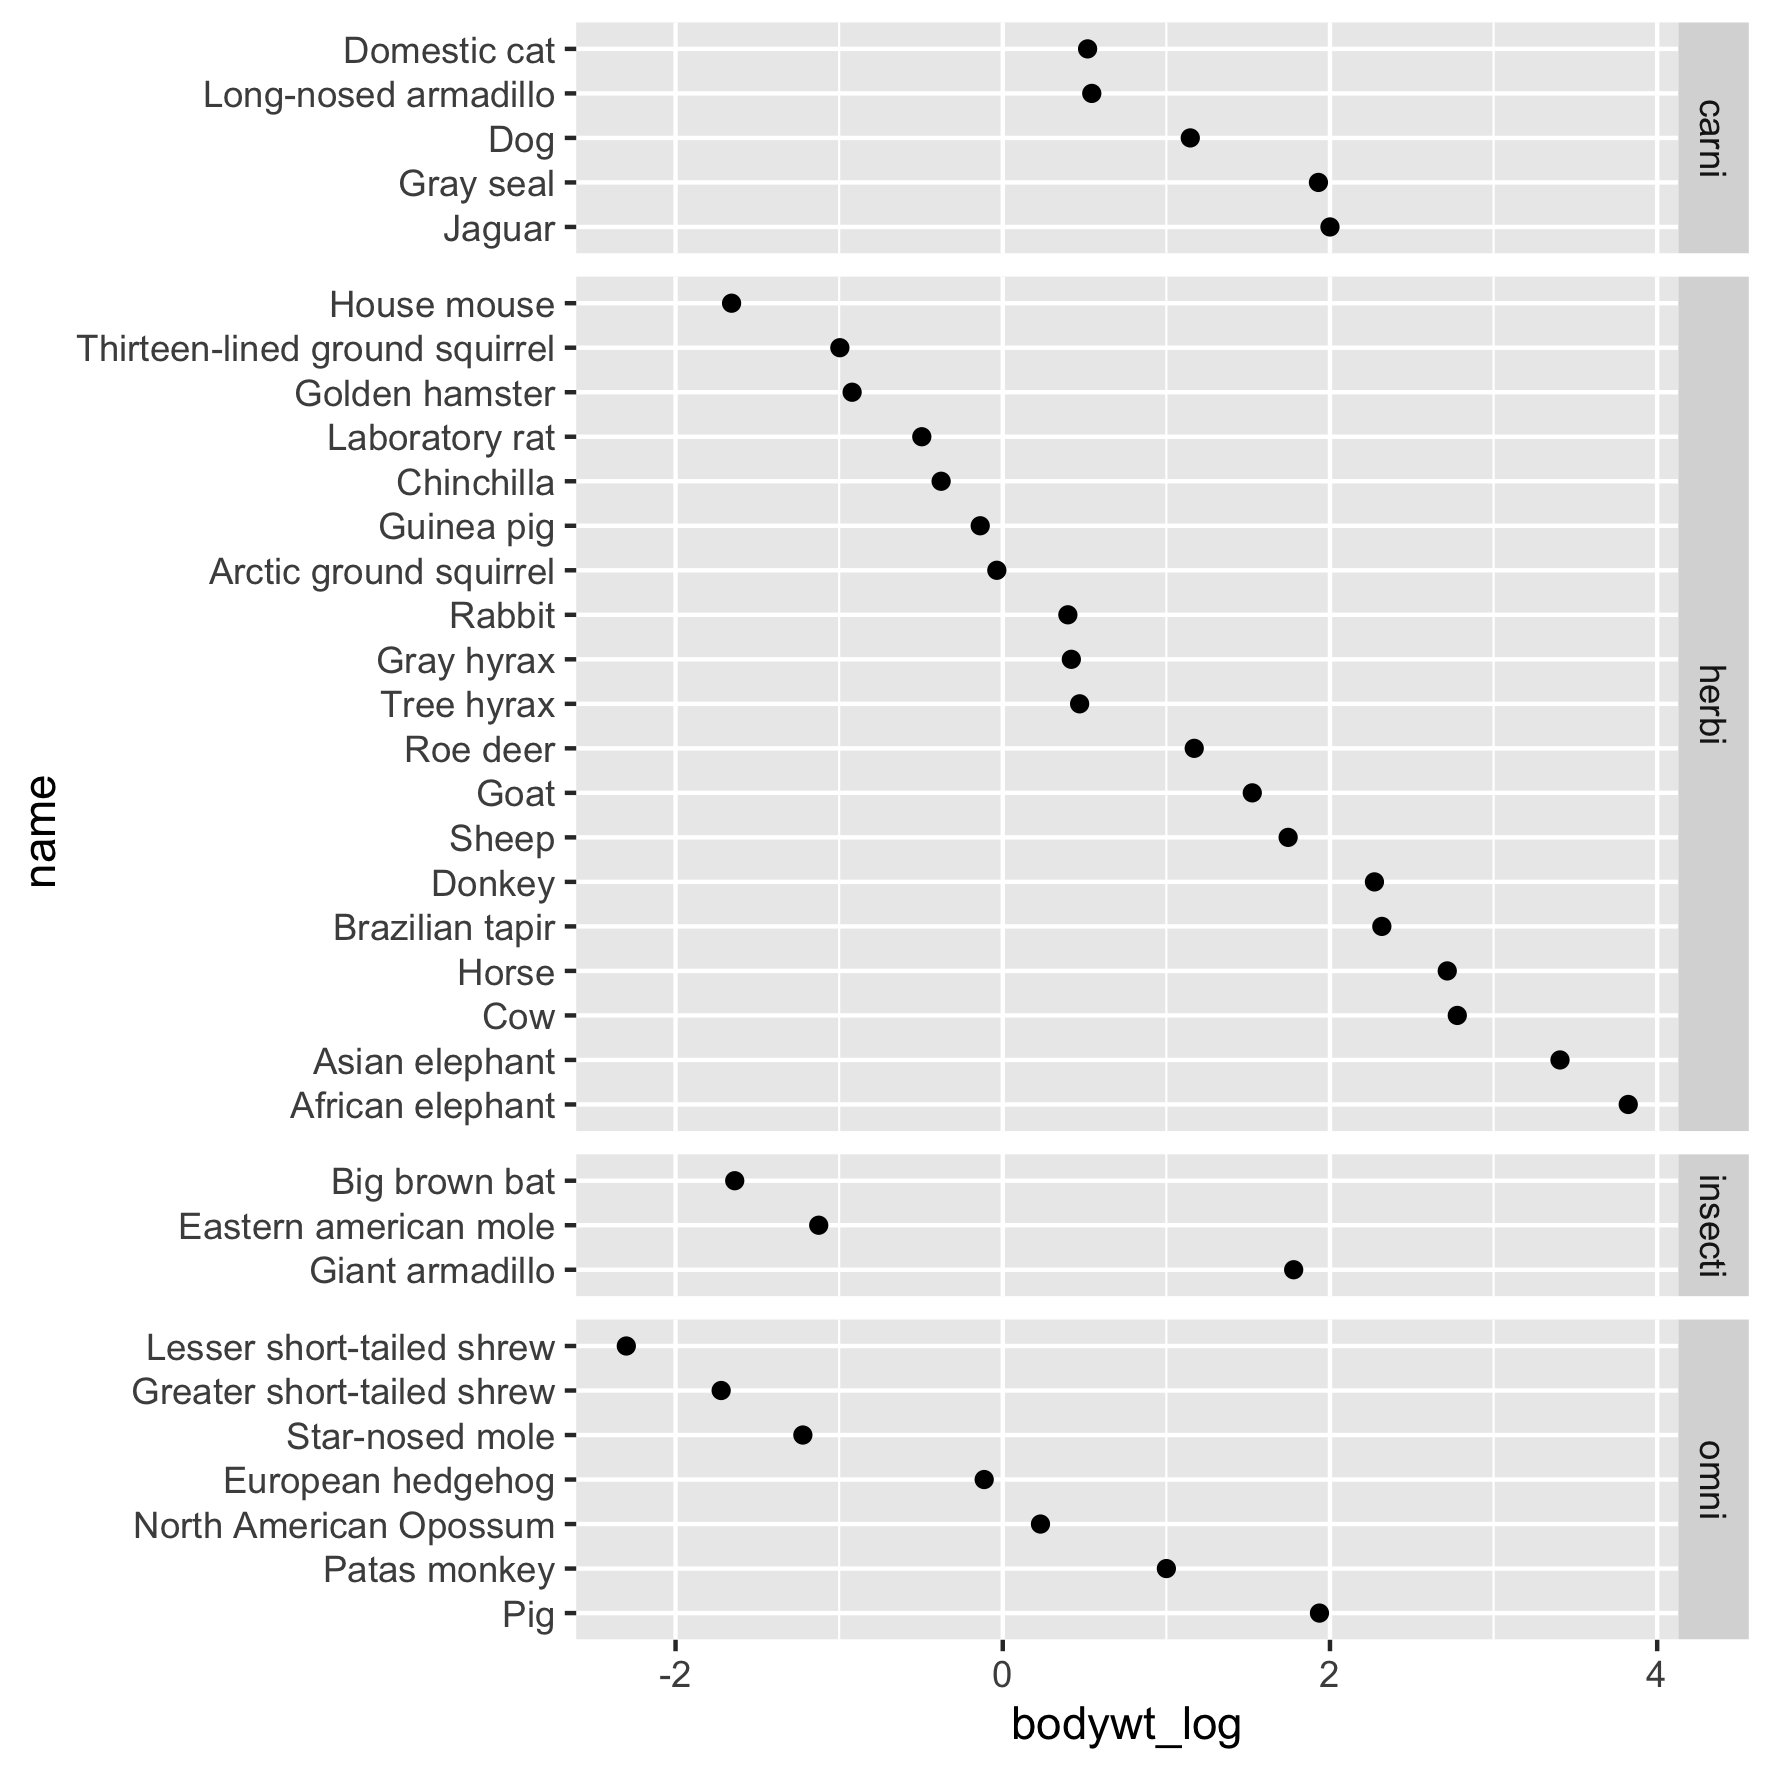
msleep2 <- msleep2 %>% 
  # Arrange from lo to hi weight
  arrange(-bodywt_log) %>% 
  # Redefine factor levels in order
  mutate(name = as_factor(name)) 

# New order is reflected in y axis
ggplot(msleep2, aes(x = bodywt_log,
                    y = name)) +
  geom_point() +
  # Free the y scales and space
  facet_grid(rows = vars(vore),
             scales = "free_y", 
             space = "free_y")

Vizualizare intermediară a datelor cu ggplot2

Să exersăm!

Vizualizare intermediară a datelor cu ggplot2

Preparing Video For Download...