Noțiuni de bază ale analizei clusterelor

Analiza clusterelor în Python

Shaumik Daityari

Business Analyst

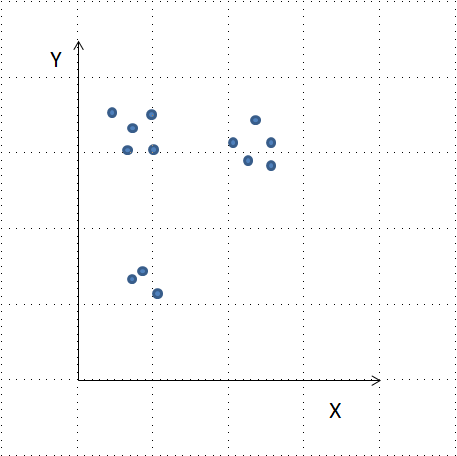
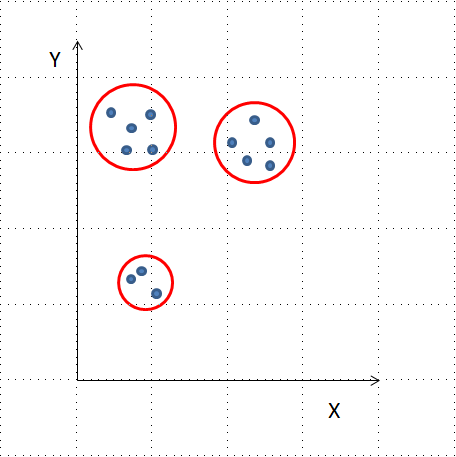
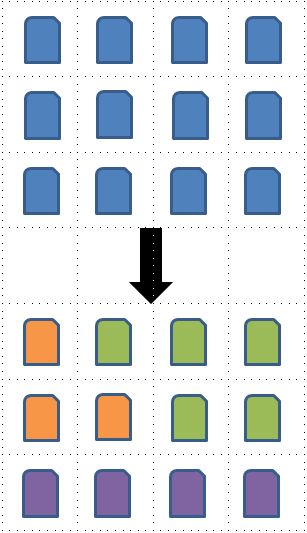
Ce este un cluster?

  • Un grup de elemente cu caracteristici similare
  • Google News: articole cu cuvinte și asocieri similare
  • Segmente de clienți

Analiza clusterelor în Python

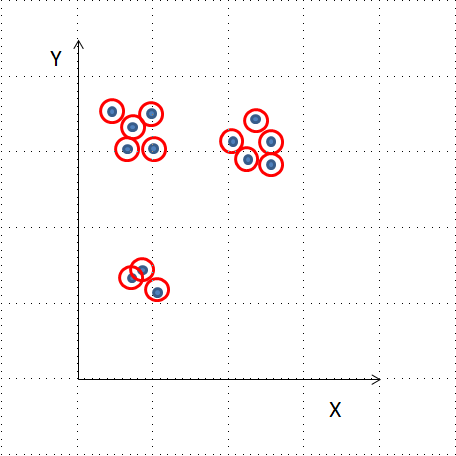
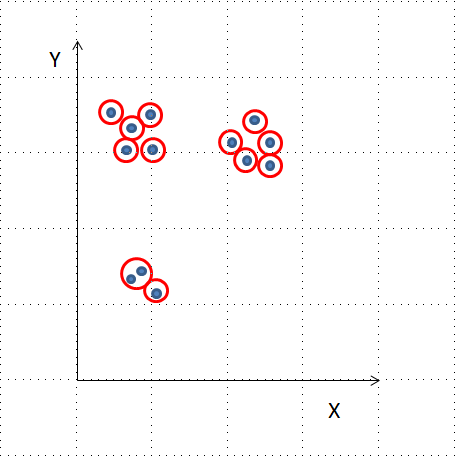
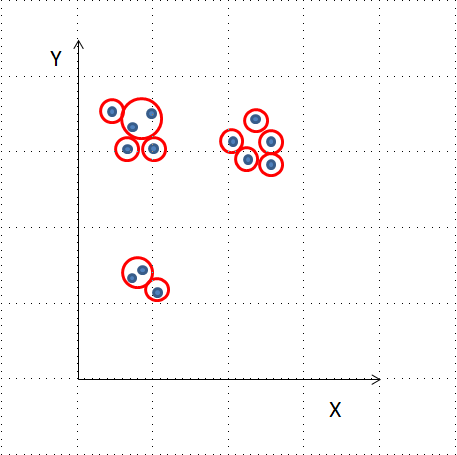
Algoritmi de clustering

  • Clustering ierarhic
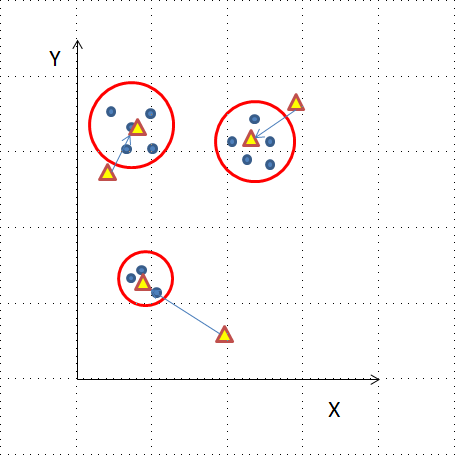
  • Clustering K-means
  • Alți algoritmi: DBSCAN, metode gaussiene
Analiza clusterelor în Python

Analiza clusterelor în Python

Analiza clusterelor în Python

Analiza clusterelor în Python

Analiza clusterelor în Python

Analiza clusterelor în Python

Clustering ierarhic în SciPy

from scipy.cluster.hierarchy import linkage, fcluster
from matplotlib import pyplot as plt
import seaborn as sns, pandas as pd
x_coordinates = [80.1, 93.1, 86.6, 98.5, 86.4, 9.5, 15.2, 3.4, 
                 10.4, 20.3, 44.2, 56.8, 49.2, 62.5, 44.0]
y_coordinates = [87.2, 96.1, 95.6, 92.4, 92.4, 57.7, 49.4, 
                 47.3, 59.1, 55.5, 25.6, 2.1, 10.9, 24.1, 10.3]

df = pd.DataFrame({'x_coordinate': x_coordinates,
                   'y_coordinate': y_coordinates})
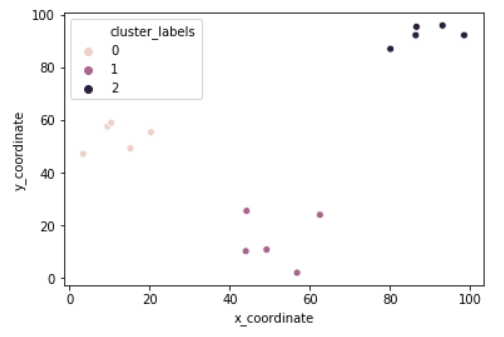
Z = linkage(df, 'ward')
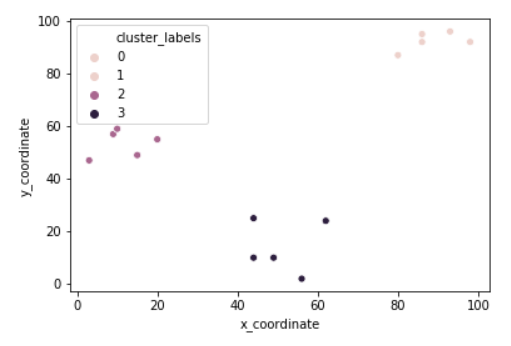
df['cluster_labels'] = fcluster(Z, 3, criterion='maxclust')
sns.scatterplot(x='x_coordinate', y='y_coordinate', 
                hue='cluster_labels', data = df)
plt.show()
Analiza clusterelor în Python

Analiza clusterelor în Python

Analiza clusterelor în Python

Analiza clusterelor în Python

Analiza clusterelor în Python

Analiza clusterelor în Python

Clustering K-means în SciPy

from scipy.cluster.vq import kmeans, vq
from matplotlib import pyplot as plt
import seaborn as sns, pandas as pd

import random
random.seed((1000,2000))
x_coordinates = [80.1, 93.1, 86.6, 98.5, 86.4, 9.5, 15.2, 3.4, 
                 10.4, 20.3, 44.2, 56.8, 49.2, 62.5, 44.0]
y_coordinates = [87.2, 96.1, 95.6, 92.4, 92.4, 57.7, 49.4, 
                 47.3, 59.1, 55.5, 25.6, 2.1, 10.9, 24.1, 10.3]

df = pd.DataFrame({'x_coordinate': x_coordinates, 'y_coordinate': y_coordinates})
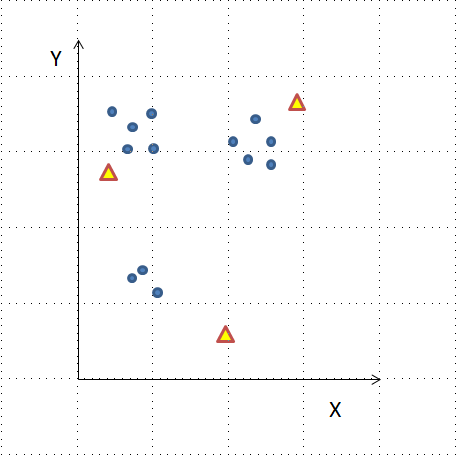
centroids,_ = kmeans(df, 3)
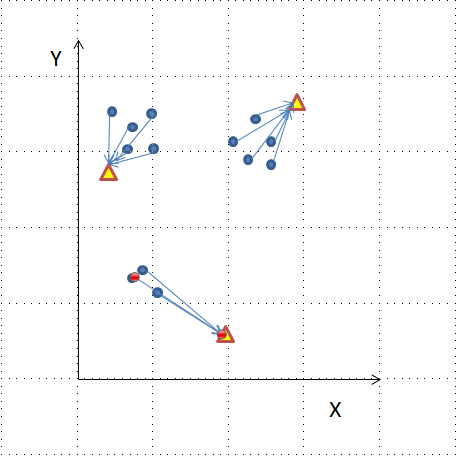
df['cluster_labels'], _ = vq(df, centroids)
sns.scatterplot(x='x_coordinate', y='y_coordinate', 
                hue='cluster_labels', data = df)
plt.show()
Analiza clusterelor în Python

Analiza clusterelor în Python

Urmează: exerciții practice

Analiza clusterelor în Python

Preparing Video For Download...