Două variabile explicative numerice

Regresie intermediară cu statsmodels în Python

Maarten Van den Broeck

Content Developer at DataCamp

Vizualizarea a trei variabile numerice

  • Grafic scatter 3D
  • Grafic scatter 2D cu răspunsul ca și culoare
Regresie intermediară cu statsmodels în Python

O coloană suplimentară în setul de date pentru pești

species mass_g length_cm height_cm
Bream 1000 33.5 18.96
Bream 925 36.2 18.75
Roach 290 24.0 8.88
Roach 390 29.5 9.48
Perch 1100 39.0 12.80
Perch 1000 40.2 12.60
Pike 1250 52.0 10.69
Pike 1650 59.0 10.81
Regresie intermediară cu statsmodels în Python

Grafic scatter 3D

Grafic scatter 3D pentru toate speciile de pești, cu lungimea, masa și înălțimea pe axe. Este dificil de interpretat în plan 2D.

Regresie intermediară cu statsmodels în Python

Grafic scatter 2D, culoare pentru răspuns
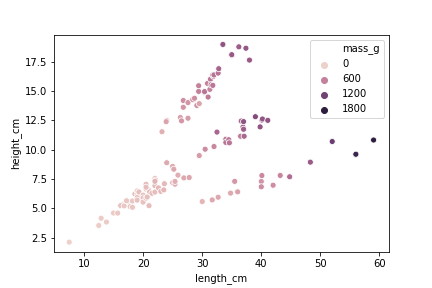
sns.scatterplot(x="length_cm", 
                y="height_cm",
                data=fish,
                hue="mass_g")

Grafic scatter 2D, cu masa colorată pentru a vizualiza o a treia variabilă numerică.

Regresie intermediară cu statsmodels în Python

Modelare cu două variabile explicative numerice

mdl_mass_vs_both = ols("mass_g ~ length_cm + height_cm",
                       data=fish).fit()

print(mdl_mass_vs_both.params)
Intercept   -622.150234
length_cm     28.968405
height_cm     26.334804
Regresie intermediară cu statsmodels în Python

Fluxul de predicție

from itertools import product

length_cm = np.arange(5, 61, 5)
height_cm = np.arange(2, 21, 2)

p = product(length_cm, height_cm)

explanatory_data = pd.DataFrame(p,
                                columns=["length_cm",
                                         "height_cm"])
prediction_data = explanatory_data.assign(
  mass_g = mdl_mass_vs_both.predict(explanatory_data))
print(prediction_data)
     length_cm  height_cm       mass_g
0            5          2  -424.638603
1            5          4  -371.968995
2            5          6  -319.299387
3            5          8  -266.629780
4            5         10  -213.960172
..         ...        ...          ...
115         60         12  1431.971694
116         60         14  1484.641302
117         60         16  1537.310909
118         60         18  1589.980517
119         60         20  1642.650125

[120 rows x 3 columns]
Regresie intermediară cu statsmodels în Python

Vizualizarea predicțiilor

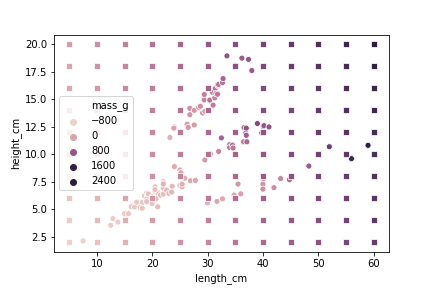
sns.scatterplot(x="length_cm",
                y="height_cm",
                data=fish,
                hue="mass_g")
sns.scatterplot(x="length_cm",
                y="height_cm",
                data=prediction_data,
                hue="mass_g",
                legend=False,
                marker="s")
plt.show()

Grafic scatter pentru lungimea, înălțimea și masa peștilor, cu o grilă de predicție.

Regresie intermediară cu statsmodels în Python

Includerea unui termen de interacțiune

mdl_mass_vs_both_inter = ols("mass_g ~ length_cm * height_cm",
                             data=fish).fit()
print(mdl_mass_vs_both_inter.params)
Intercept              159.107480
length_cm                0.301426
height_cm              -78.125178
length_cm:height_cm      3.545435
Regresie intermediară cu statsmodels în Python

Fluxul de predicție cu interacțiune

length_cm = np.arange(5, 61, 5)
height_cm = np.arange(2, 21, 2)

p = product(length_cm, height_cm)

explanatory_data = pd.DataFrame(p,
                                columns=["length_cm",
                                         "height_cm"])

prediction_data = explanatory_data.assign(
  mass_g = mdl_mass_vs_both_inter.predict(explanatory_data))
Regresie intermediară cu statsmodels în Python

Vizualizarea predicțiilor

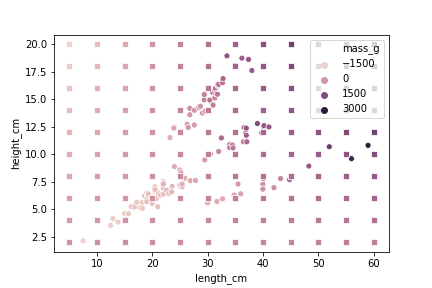
sns.scatterplot(x="length_cm",
           y="height_cm",
           data=fish,
           hue="mass_g")

sns.scatterplot(x="length_cm",
                y="height_cm",
                data=prediction_data,
                hue="mass_g",
                legend=False,
                marker="s")
plt.show()

Grafic scatter pentru lungimea, înălțimea și masa peștilor, cu un termen de interacțiune pe grila de predicție.

Regresie intermediară cu statsmodels în Python

Să exersăm!

Regresie intermediară cu statsmodels în Python

Preparing Video For Download...