Reprezentarea unei histograme

Gândire statistică în Python (Partea 1)

Justin Bois

Teaching Professor at the California Institute of Technology

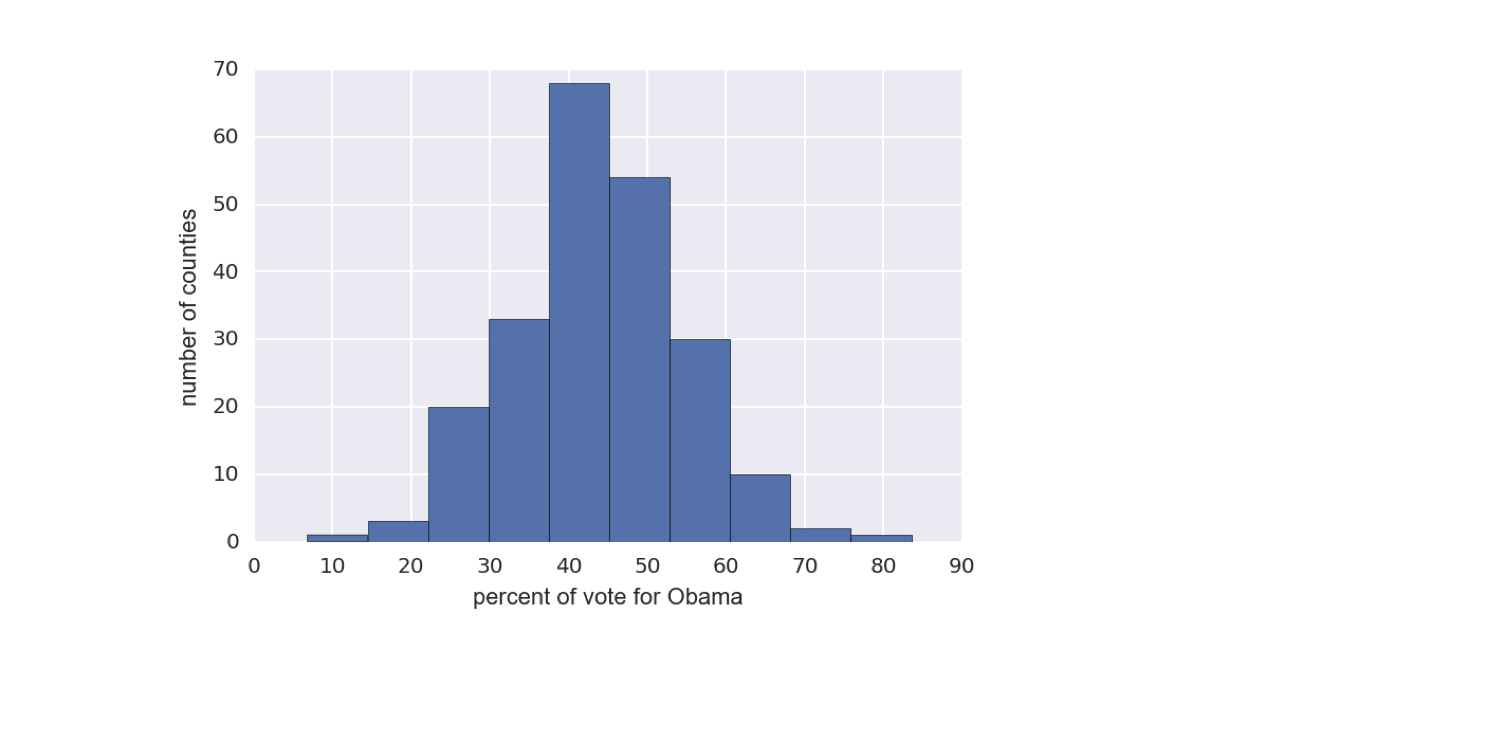
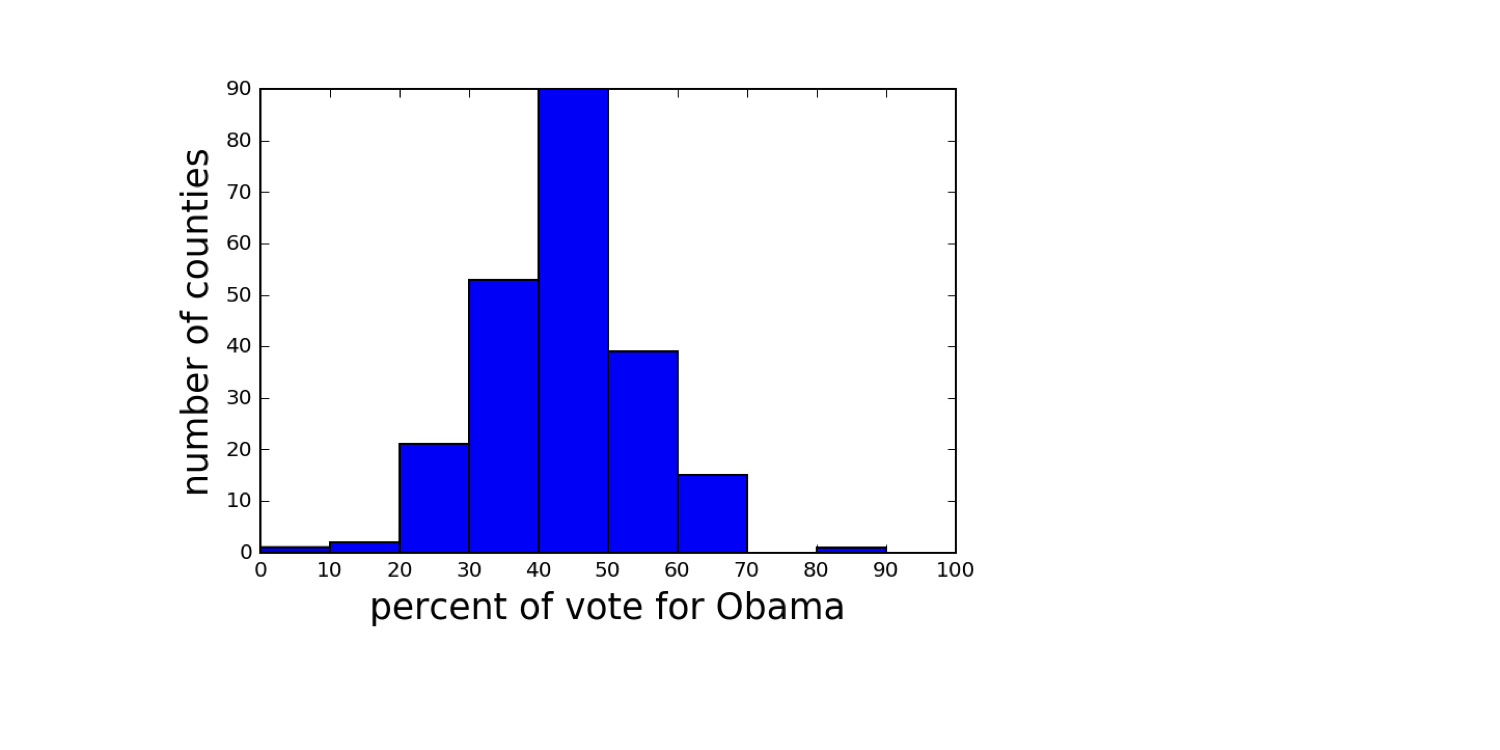
Rezultatele alegerilor din 2008 în statele indecise din SUA

Date preluate de pe Data.gov (https://www.data.gov/)
ch1-2.003.png

Gândire statistică în Python (Partea 1)

Generarea unei histograme

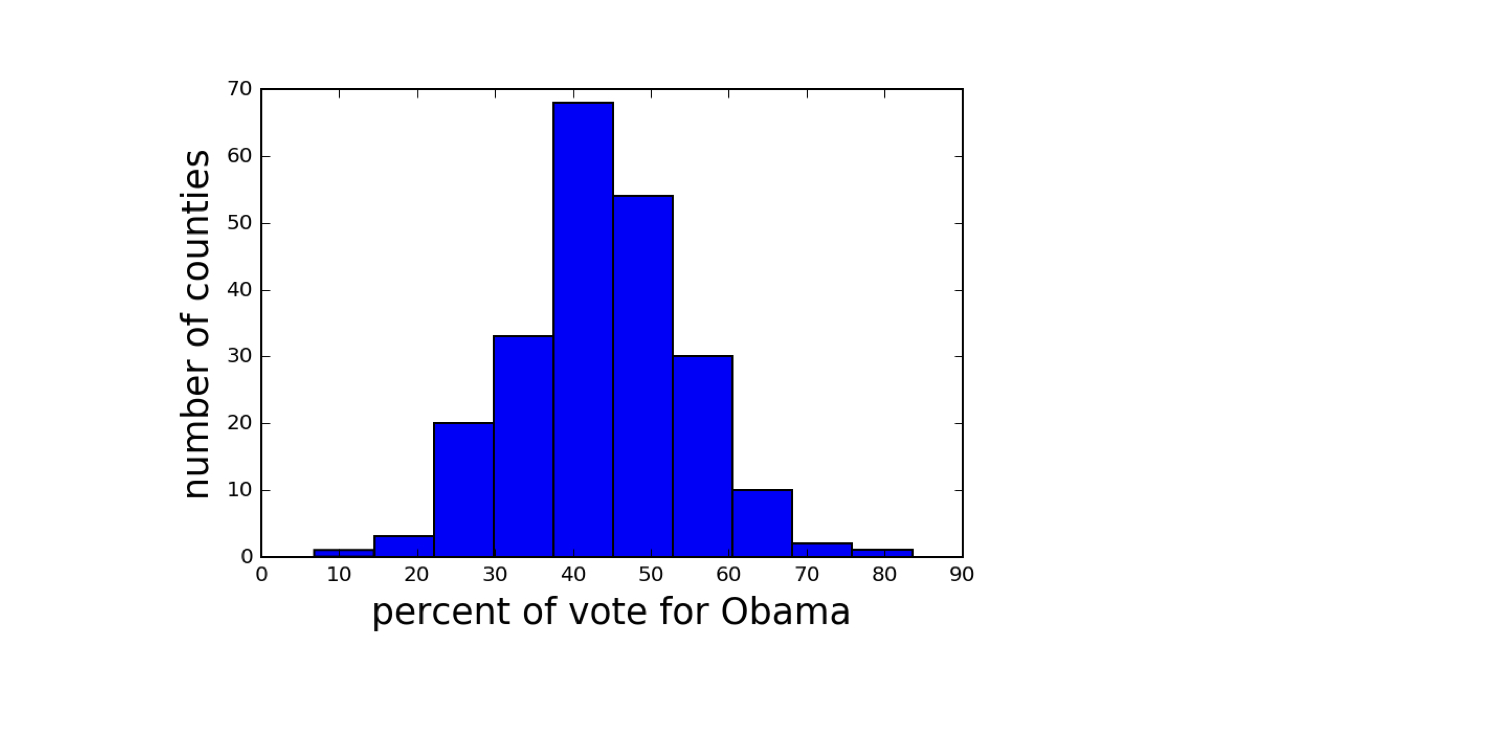
import matplotlib.pyplot as plt
_ = plt.hist(df_swing['dem_share'])
_ = plt.xlabel('percent of vote for Obama')
_ = plt.ylabel('number of counties')
plt.show()
Gândire statistică în Python (Partea 1)

Etichetați întotdeauna axele

Gândire statistică în Python (Partea 1)

Rezultatele alegerilor din 2008 în statele indecise din SUA

Date preluate de pe Data.gov (https://www.data.gov/)
ch1-2.013.png

Gândire statistică în Python (Partea 1)

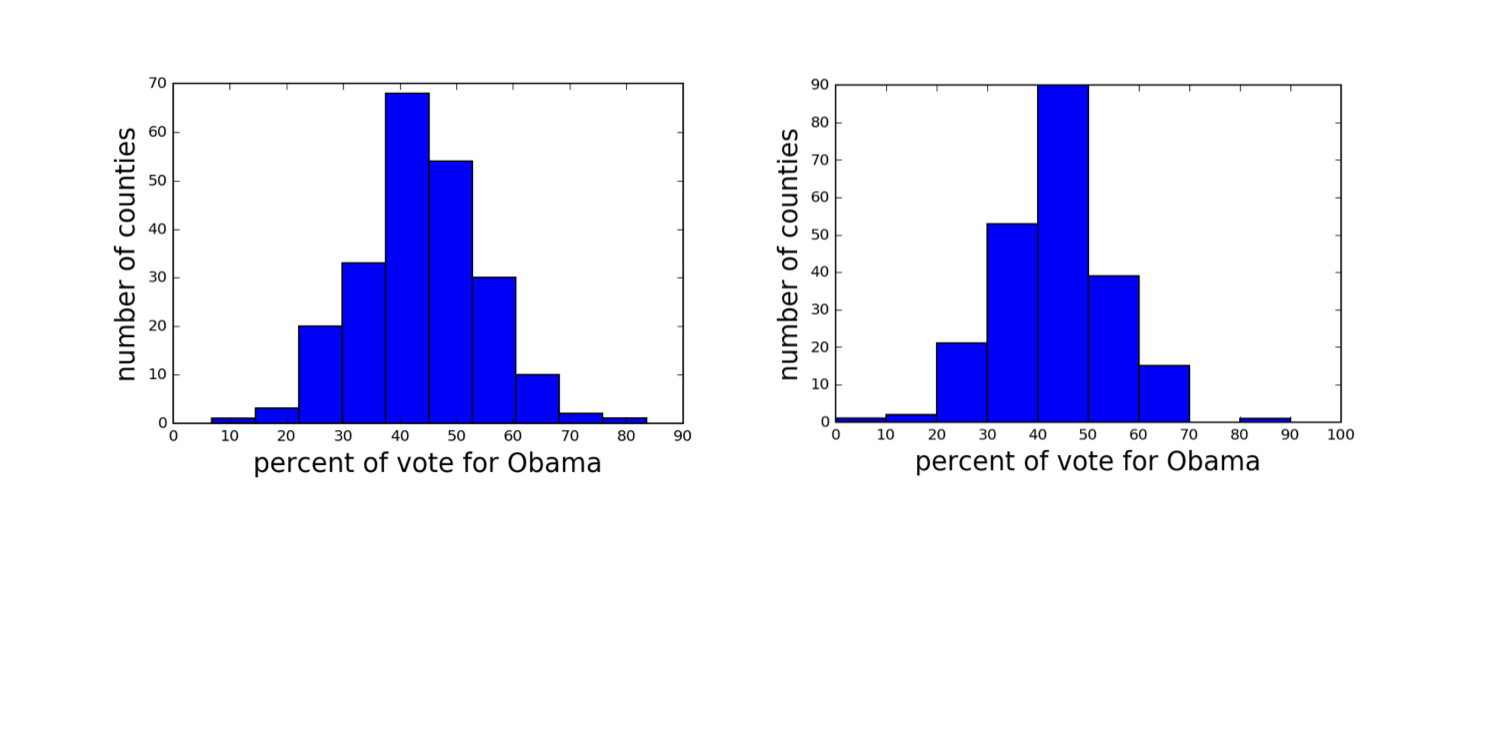
Histograme cu diferite granularități

Date preluate de pe Data.gov (https://www.data.gov/)
ch1-2.015.png

Gândire statistică în Python (Partea 1)

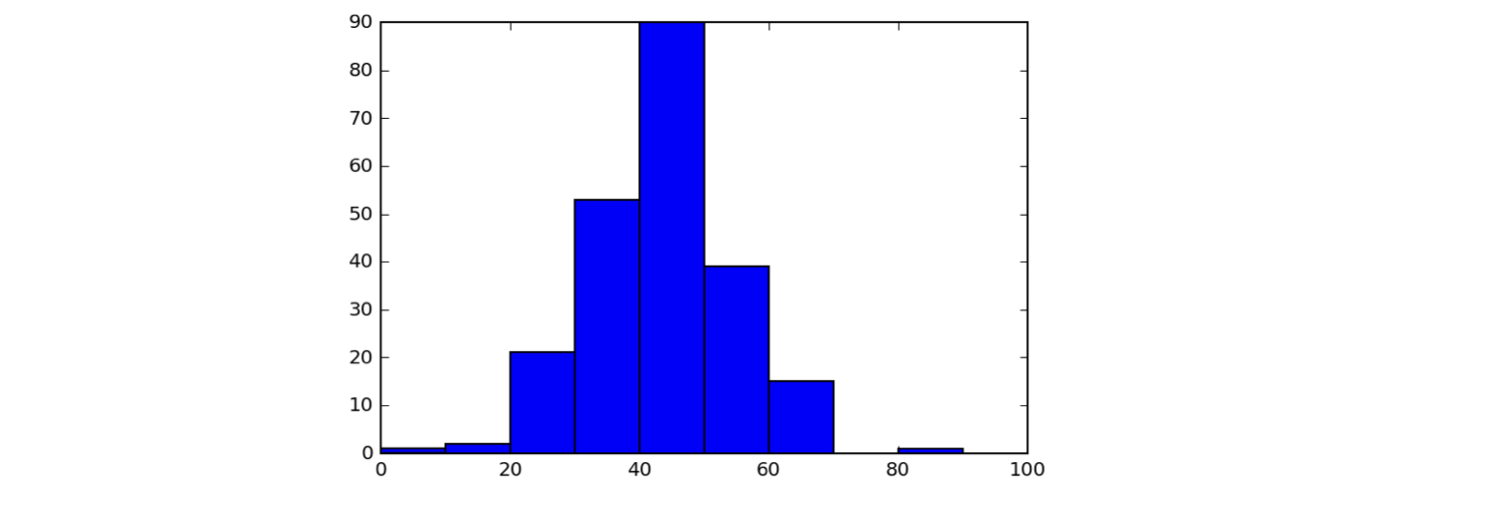
Setarea intervalelor unei histograme

bin_edges = [0, 10, 20, 30, 40, 50,
                60, 70, 80, 90, 100]
_ = plt.hist(df_swing['dem_share'], bins=bin_edges)
plt.show()
ch1-2.022.png

Gândire statistică în Python (Partea 1)

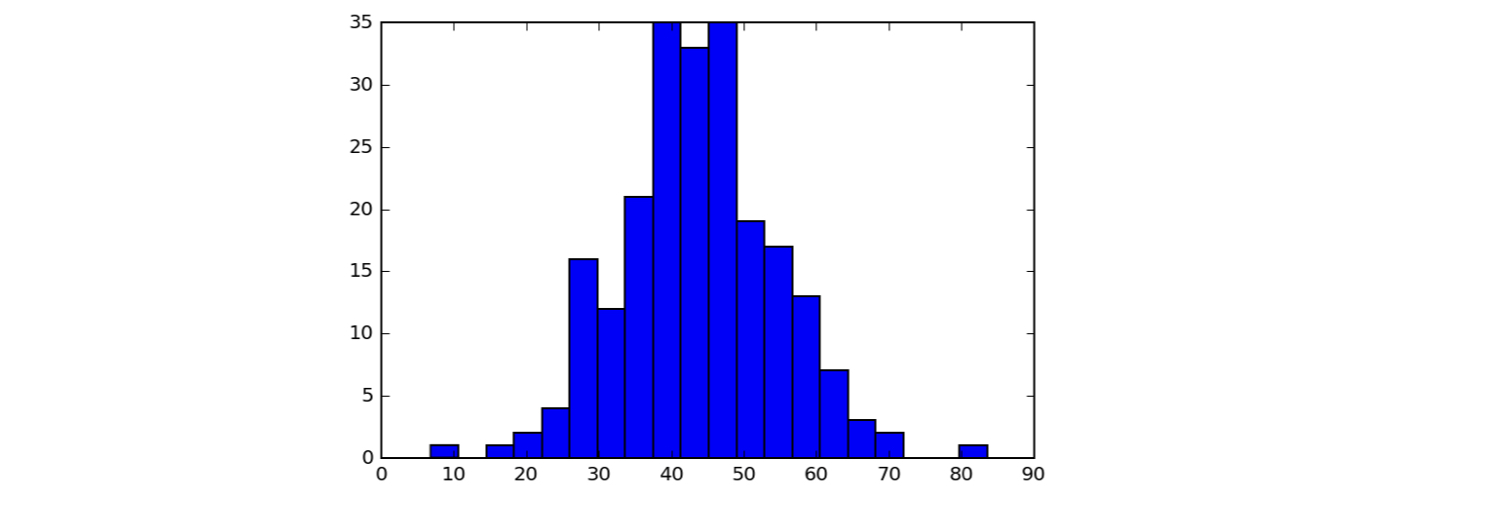
Setarea intervalelor unei histograme

_ = plt.hist(df_swing['dem_share'], bins=20)
plt.show()
ch1-2.027.png

Gândire statistică în Python (Partea 1)

Seaborn

  • Pachet excelent de vizualizare statistică bazat pe Matplotlib, creat de Michael Waskom
Gândire statistică în Python (Partea 1)

Stilizare cu Seaborn

import seaborn as sns
sns.set()
_ = plt.hist(df_swing['dem_share'])
_ = plt.xlabel('percent of vote for Obama')
_ = plt.ylabel('number of counties')
plt.show()
Gândire statistică în Python (Partea 1)

Histogramă stilizată cu Seaborn

ch1-2.038.png

1 Date preluate de pe Data.gov (https://www.data.gov/)
Gândire statistică în Python (Partea 1)

Să exersăm!

Gândire statistică în Python (Partea 1)

Preparing Video For Download...