Vizualizarea datelor geospațiale în Python
Mary van Valkenburg
Data Science Program Manager, Nashville Software School
# Construct a map object for Nashville
nashville = [36.1636,-86.7823]
m = folium.Map(location=nashville, zoom_start=10)
# Create a choropleth using the folium Choropleth class
folium.Choropleth(...)
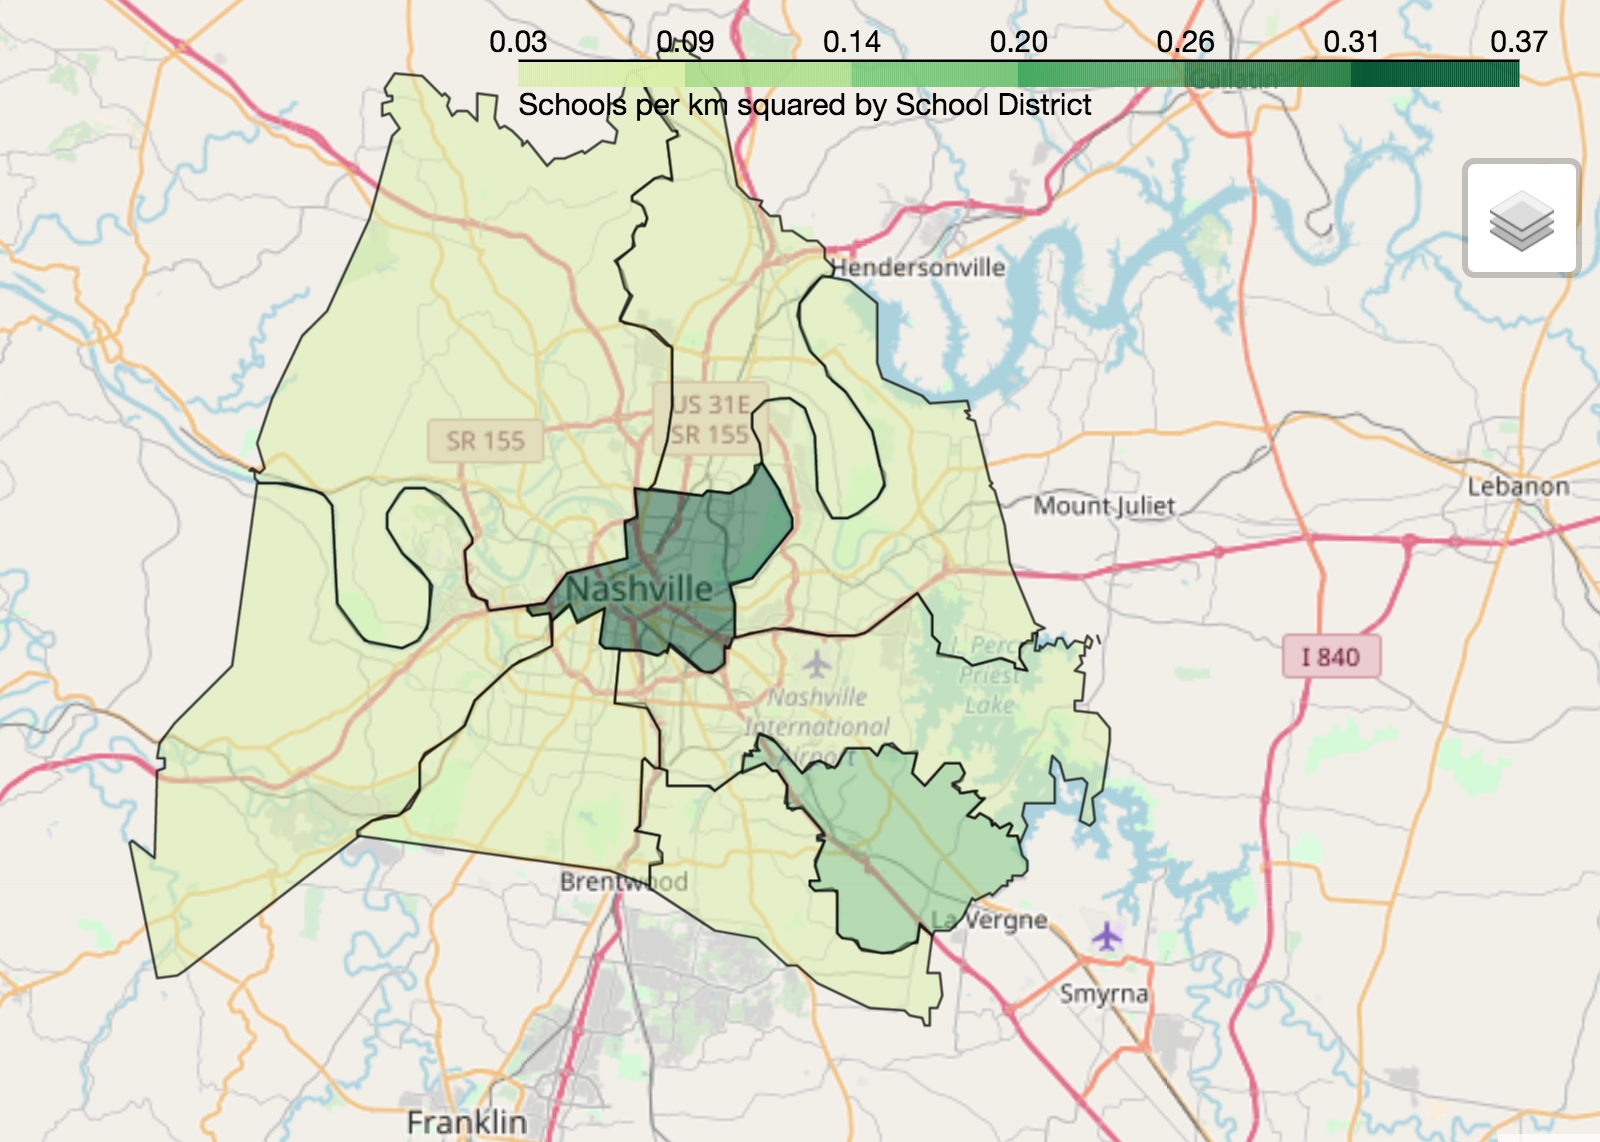
geo_data - sursa de date pentru poligoane (fișier GeoJSON sau GeoDataFrame)name - numele coloanei de geometrie (sau proprietății GeoJSON) pentru poligoanedata - DataFrame-ul sau seria sursă pentru datele normalizatecolumns - o listă de coloane: una care corespunde poligoanelor și una cu valorile de reprezentatkey_on - o variabilă GeoJSON pentru legarea datelor (începe întotdeauna cu feature)fill_color - culoarea de umplere a poligoanelor (implicit albastru) fill_opacity - interval între 0 (transparent) și 1 (complet opac)line_color - culoarea conturului poligoanelor (implicit negru)line_opacity - interval între 0 (transparent) și 1 (complet opac) legend_name - titlul legendei# Center point and map for Nashville
nashville = [36.1636,-86.7823]
m = folium.Map(location=nashville, zoom_start=10)
# Define a choropleth layer for the map
folium.Choropleth(
geo_data=districts_with_counts,
name='geometry',
data=districts_with_counts,
columns=['district', 'school_density'],
key_on='feature.properties.district',
fill_color='YlGn',
fill_opacity=0.75,
line_opacity=0.5,
legend_name='Schools per km squared by School District'
).add_to(m)
folium.LayerControl().add_to_map()
display(m)

Vizualizarea datelor geospațiale în Python