Crearea markerelor și popupurilor în folium

Vizualizarea datelor geospațiale în Python

Mary Van Valkenburg

Data Science Program Manager, Nashville Software School

for row in schools_in_dist1.iterrows():
    row_values = row[1]
    print(row_values)
name                              Alex Green Elementary
lat                                              36.253
lng                                            -86.8322
geometry                 POINT (-86.8322292 36.2529607)
district                                              1
center      POINT (-86.86086595994405 36.2628221811899)
Name: 1, dtype: object
name                               Bellshire Elementary
lat                                             36.2697
lng                                            -86.7623
geometry               POINT (-86.76230026 36.26968766)
district                                              1
center      POINT (-86.86086595994405 36.2628221811899)
Name: 8, dtype: object
Vizualizarea datelor geospațiale în Python

Construirea locațiilor markerelor

# Construct a folium map for school district 1
district1_map = folium.Map(location = district_center, zoom_start = 11)

#create a marker for each school
for row in schools_in_dist1.iterrows():
    row_values = row[1]
    location = [row_values['lat'], row_values['lng']]
    marker = folium.Marker(location = location)
    marker.add_to(district1_map)

display(district1_map)
Vizualizarea datelor geospațiale în Python

Construirea locațiilor markerelor

hartă stradală Nashville cu markere folium

Vizualizarea datelor geospațiale în Python

Crearea popupurilor din datele unui DataFrame
# Construct a folium map for school district 1
district1_map = folium.Map(location = district_center, zoom_start = 11)

# Create a marker for each school
for row in schools_in_dist1.iterrows():
    row_values = row[1]
    location = [row_values['lat'], row_values['lng']]
    popup = popup = '<strong>' + row_values['name'] + '</strong>'
    marker = folium.Marker(location = location, popup = popup)
    marker.add_to(district1_map)

display(district1_map)
Vizualizarea datelor geospațiale în Python

Crearea popupurilor din datele unui DataFrame

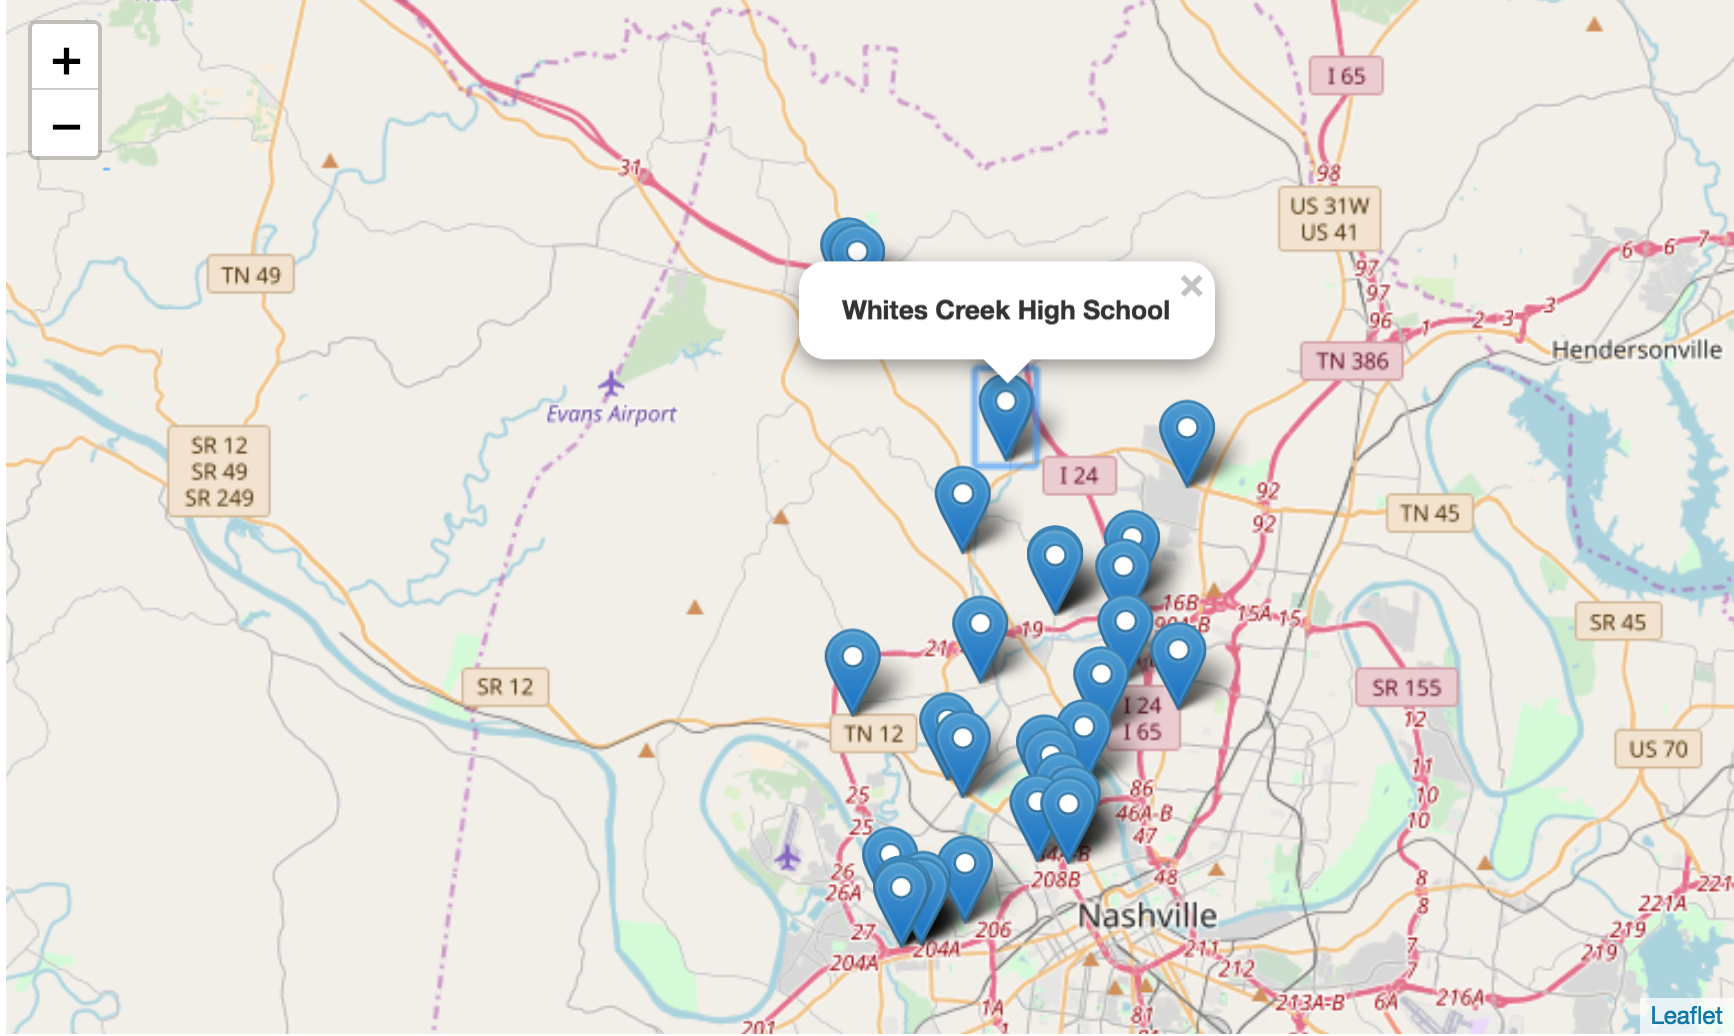
hartă stradală Nashville cu markere și un popup care afișează 'Whites Creek High School'

Vizualizarea datelor geospațiale în Python

Depanarea popupurilor

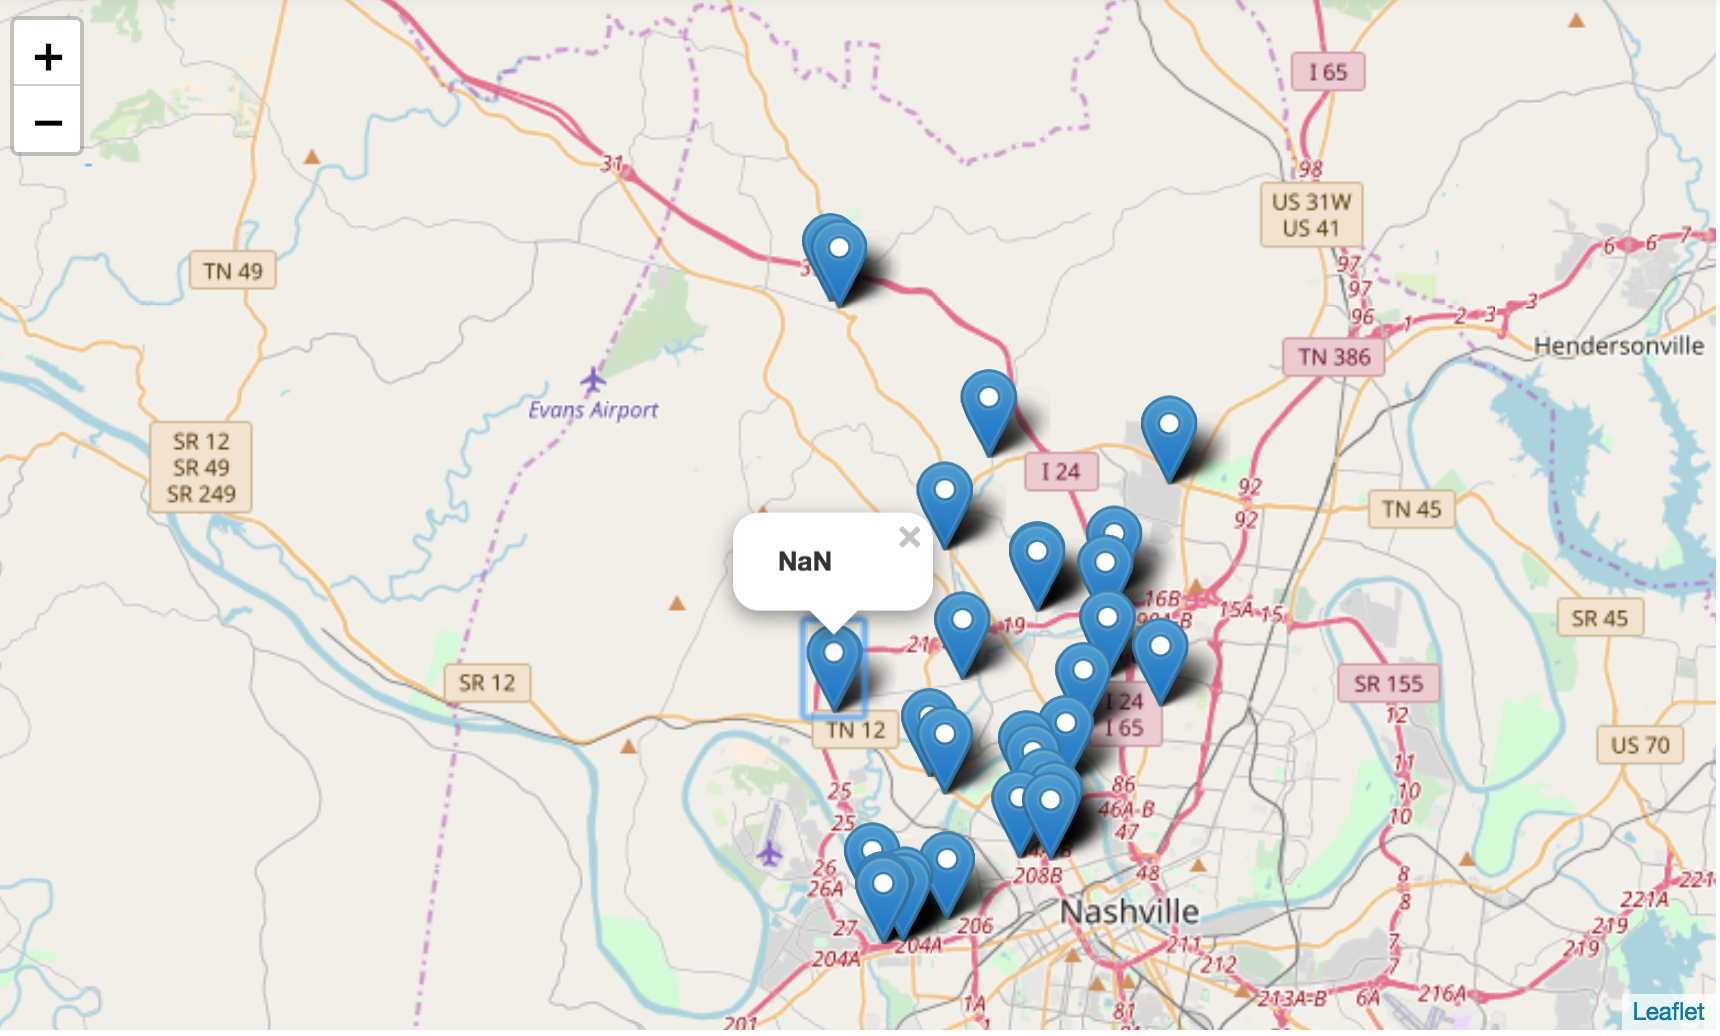
hartă stradală Nashville cu markere și un popup care afișează 'NaN'

Vizualizarea datelor geospațiale în Python

Să exersăm!

Vizualizarea datelor geospațiale în Python

Preparing Video For Download...