Regresia logistică
A/B Testing în R

Lauryn Burleigh
Data Scientist
Logaritmul în logistică
- Binară
- Mâncați pizza din nou - da/nu
- Derivarea probabilității categoriei
- Variabila dependentă prezisă
- Cote = P / 1-P
- Liniară față de variabila independentă
- log(P / 1-P) = β₀ + β₁X₁
- eroare în log-cote
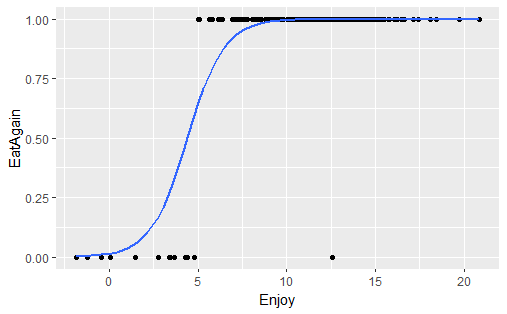
Modelul de regresie logistică
logistic <- glm(EatAgain ~ Enjoy,
                data = Pizza,
                family = binomial)
summary(logistic)
chival <- logistic$null.deviance - logistic$deviance
dfval <- logistic$df.null - logistic$df.residual
pchisq(q = chival, df = dfval, lower.tail = FALSE)
[1] 7.472441e-16
Call:
glm(formula = EatAgain ~ Enjoy, family = binomial,
data = pizza)

Deviance Residuals:
    Min       1Q   Median       3Q      Max
-3.9677   0.0116   0.0297   0.0885   0.9446

Coefficients:
            Estimate Std. Error z value Pr(>|z|)
(Intercept)  -4.2361     1.4757  -2.871 0.004097 **
Enjoy         0.9611     0.2533   3.794 0.000148 ***

Null deviance: 96.204  on 199  degrees of freedom
Residual deviance: 31.199  on 198  degrees of freedom
AIC: 35.199
Number of Fisher Scoring iterations: 9
Predicția datelor
Enjoy  <- c(12, 14)
topredict <-  data.frame(Enjoy)
predict(logistic, topredict,
        type = "response")
        1         2
0.9993229 0.9999009
Includerea grupurilor
grplogistic <- glm(EatAgain ~ Enjoy +
                   Topping,
                   data = pizza,
                   family = binomial)
summary(grplogistic)
Call:
glm(formula = EatAgain ~ Enjoy + Topping, family = binomial,
    data = pizza)

Deviance Residuals:
    Min       1Q   Median       3Q      Max
-3.8557   0.0058   0.0222   0.0862   0.8887

Coefficients:
                 Estimate Std. Error z value Pr(>|z|)
(Intercept)       -9.4498     3.8806  -2.435  0.01489 *
Enjoy              1.3402     0.4118   3.255  0.00114 **
ToppingCheese   3.4652     2.0499   1.690  0.09095 .

Null deviance: 96.204  on 199  degrees of freedom
Residual deviance: 28.232  on 197  degrees of freedom
AIC: 34.232

Number of Fisher Scoring iterations: 9
Să exersăm!
A/B Testing în R

