Vizualizarea datelor de tip serie temporală în Python
Thomas Vincent
Head of Data Science, Getty Images
t_1, t_2, t_3, ...) și valorile sale decalate cu 3 puncte temporale, adică (t_4, t_5, t_6, ...)
statsmodelseste un modul Python care oferă clase și funcții pentru estimarea diverselor modele statistice, efectuarea de teste statistice și explorarea datelor statistice.
import matplotlib.pyplot as plt
from statsmodels.graphics import tsaplots
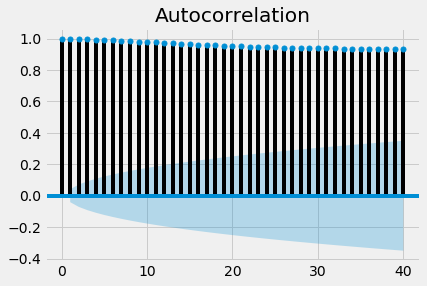
fig = tsaplots.plot_acf(co2_levels['co2'], lags=40)
plt.show()

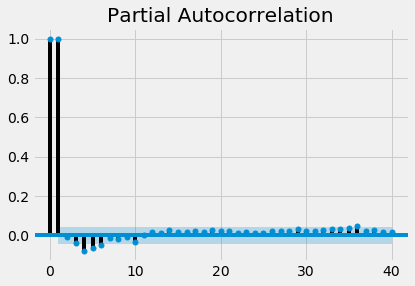
order 3 returnează corelația dintre seria de timp (t1, t2, t3, ...) și valorile sale decalate cu 3 puncte temporale (t4, t5, t6, ...), după eliminarea efectelor atribuibile lag-urilor 1 și 2import matplotlib.pyplot as plt
from statsmodels.graphics import tsaplots
fig = tsaplots.plot_pacf(co2_levels['co2'], lags=40)
plt.show()

Vizualizarea datelor de tip serie temporală în Python