Rezumarea valorilor din datele de serie temporală

Vizualizarea datelor de tip serie temporală în Python

Thomas Vincent

Head of Data Science, Getty Images

Obținerea rezumatelor numerice ale datelor

  • Care este valoarea medie a acestor date?
  • Care este valoarea maximă observată în această serie temporală?
Vizualizarea datelor de tip serie temporală în Python

Metoda .describe() calculează automat statistici cheie pentru toate coloanele numerice din DataFrame

print(df.describe())
               co2
count  2284.000000
mean    339.657750
std      17.100899
min     313.000000
25%     323.975000
50%     337.700000
75%     354.500000
max     373.900000
Vizualizarea datelor de tip serie temporală în Python

Rezumarea datelor cu diagrame boxplot

ax1 = df.boxplot()
ax1.set_xlabel('Your first boxplot')
ax1.set_ylabel('Values of your data')
ax1.set_title('Boxplot values of your data')

plt.show()
Vizualizarea datelor de tip serie temporală în Python

Diagramă boxplot a valorilor din datele CO2
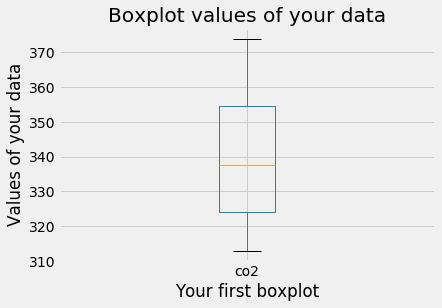
Diagramă boxplot a seriei temporale

Vizualizarea datelor de tip serie temporală în Python

Rezumarea datelor cu histograme

ax2 = df.plot(kind='hist', bins=100)
ax2.set_xlabel('Your first histogram')
ax2.set_ylabel('Frequency of values in your data')
ax2.set_title('Histogram of your data with 100 bins')

plt.show()
Vizualizarea datelor de tip serie temporală în Python

Histogramă a valorilor din datele CO2
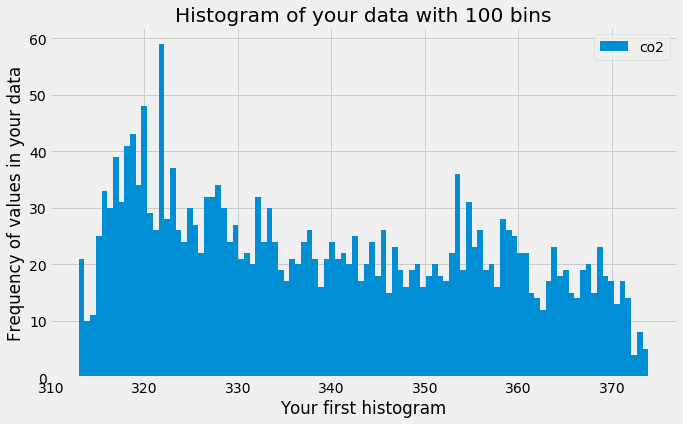
Histogramă cu 100 de intervale

Vizualizarea datelor de tip serie temporală în Python

Rezumarea datelor cu grafice de densitate

ax3 = df.plot(kind='density', linewidth=2)
ax3.set_xlabel('Your first density plot')
ax3.set_ylabel('Density values of your data')
ax3.set_title('Density plot of your data')

plt.show()
Vizualizarea datelor de tip serie temporală în Python

Grafic de densitate a valorilor din datele CO2
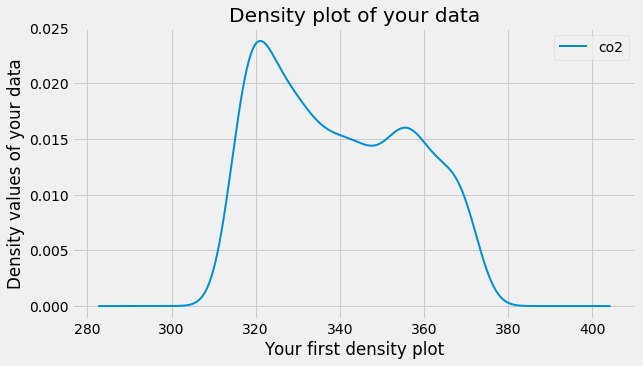
Grafic de densitate a datelor

Vizualizarea datelor de tip serie temporală în Python

Să exersăm!

Vizualizarea datelor de tip serie temporală în Python

Preparing Video For Download...