Introducere în serii de timp
Detecția anomaliilor în Python

Bekhruz (Bex) Tuychiev
Kaggle Master, Data Science Content Creator
Setul de date al acțiunilor Google
import pandas as pd

google = pd.read_csv("google.csv")
google.head()
              Open    High     Low   Close    Volume
Date
2006-01-03  211.47  218.05  209.32  217.83  13137450
2006-01-04  222.17  224.70  220.09  222.84  15292353
2006-01-05  223.22  226.00  220.97  225.85  10815661
2006-01-06  228.66  235.49  226.85  233.06  17759521
2006-01-09  233.44  236.94  230.70  233.68  12795837
Tipul de date DateTime
print(google['Date'].dtype)
object
google['Date'] = pd.to_datetime(google['Date'])

print(google.dtypes)
Date      datetime64[ns]
Open             float64
High             float64
...
Extragerea caracteristicilor
google['day_of_week'] = google['Date'].dt.day_of_week google['day_of_month'] = google['Date'].dt.day google['month'] = google['Date'].dt.monthgoogle.sample(5)
      Date    Open     Low   Close   Volume  day_of_week  month   day_of_month
2016-02-29  721.00  716.84  717.22  2237474            0      2             29
2007-01-24  242.46  241.89  249.78  6074077            2      1             24
2007-05-24  237.81  235.99  237.40  4200474            3      5             24
2008-09-16  213.19  212.96  221.69  6991767            1      9             16
2008-03-31  218.04  216.22  220.46  4446368            0      3             31
DatetimeIndex
google.set_index("Date", inplace=True)

google.head()
              Open    High     Low   Close    Volume  day_of_week  month  \
Date
2006-01-03  211.47  218.05  209.32  217.83  13137450            1      1
2006-01-04  222.17  224.70  220.09  222.84  15292353            2      1
2006-01-05  223.22  226.00  220.97  225.85  10815661            3      1
2006-01-06  228.66  235.49  226.85  233.06  17759521            4      1
2006-01-09  233.44  236.94  230.70  233.68  12795837            0      1
Selectarea perioadelor
google["2008": "2010"].head()
              Open    High     Low   Close   Volume  day_of_week  month  \
Date
2008-01-02  346.78  349.03  339.20  342.94  4306848            2      1
2008-01-03  342.97  343.77  338.60  343.01  3252846            3      1
2008-01-04  340.18  340.82  327.83  328.83  5359834            4      1
2008-01-07  327.30  331.47  318.99  324.95  6404945            0      1
2008-01-08  326.83  330.31  315.82  316.16  5341949            1      1
Selectarea perioadelor
google["2012-03": "2015-10-04"].head()
              Open    High     Low   Close   Volume  day_of_week  month  \
Date
2012-03-01  311.44  313.16  309.38  311.51  2238010            3      3
2012-03-02  311.31  312.31  310.47  310.94  1573214            4      3
2012-03-05  310.53  311.56  306.00  307.43  1593250            0      3
2012-03-06  304.33  304.71  297.22  302.78  3175216            1      3
2012-03-07  304.83  305.90  303.23  303.70  1264892            2      3
Încărcarea seturilor de date cu DatetimeIndex
google = pd.read_csv("google.csv", parse_dates=["Date"], index_col="Date")

google.head()
              Open    High     Low   Close    Volume
Date
2006-01-03  211.47  218.05  209.32  217.83  13137450
2006-01-04  222.17  224.70  220.09  222.84  15292353
2006-01-05  223.22  226.00  220.97  225.85  10815661
2006-01-06  228.66  235.49  226.85  233.06  17759521
2006-01-09  233.44  236.94  230.70  233.68  12795837
Vizualizarea seriilor de timp
import matplotlib.pyplot as plt

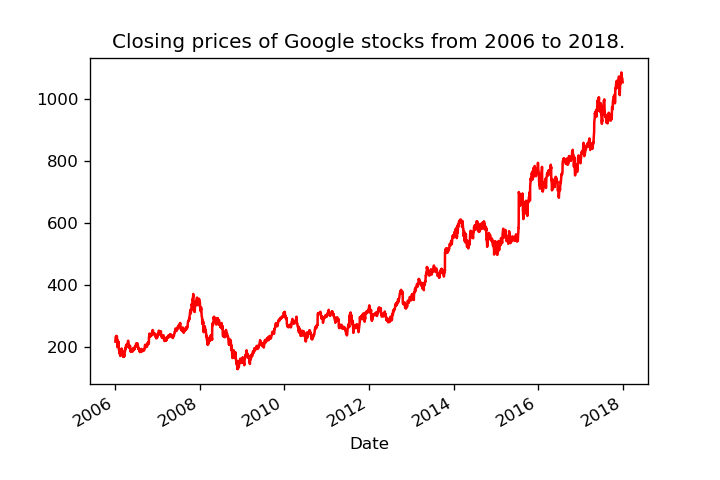
google["Close"].plot(color="red")

plt.title("""Closing prices of Google
stocks from 2006 to 2018.""")
plt.show()
Vizualizarea seriilor de timp
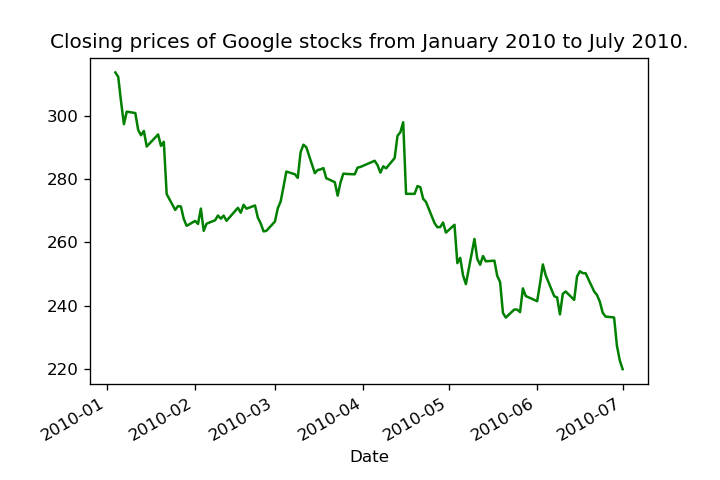
google["2010": "2010-07-01"]['Close'].plot(color="green")

plt.title("Closing prices of Google stocks from January 2010 to July 2010.")
plt.show()
Vizualizarea seriilor de timp
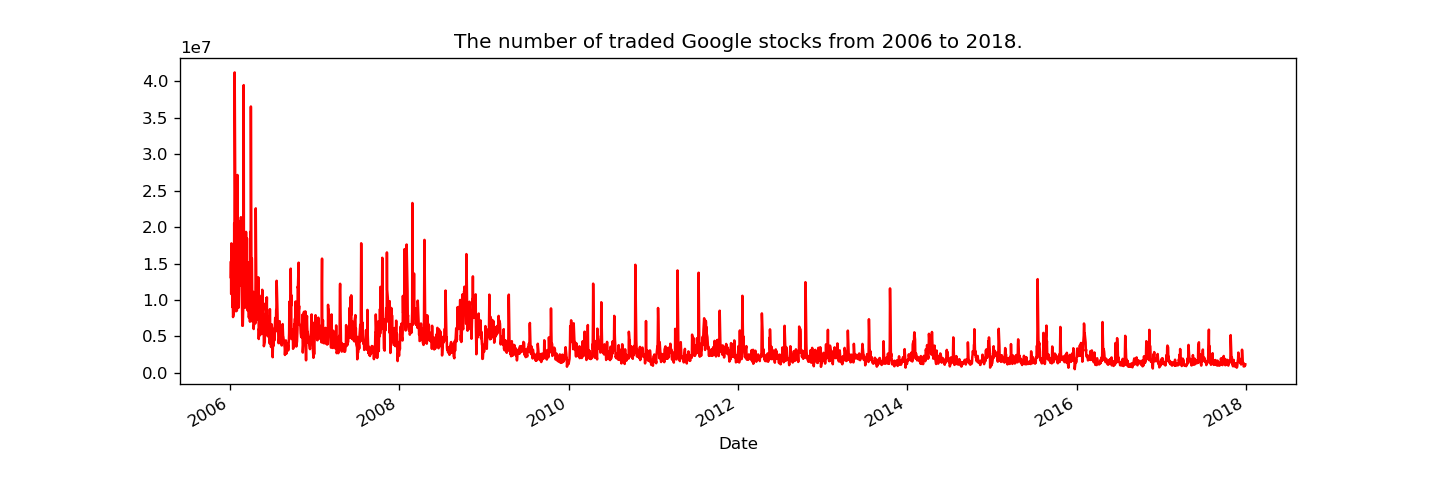
google['Volume'].plot(color='red', figsize=(12, 4))

plt.title("The number of traded Google stocks from 2006 to 2018.")
MAD pe serii de timp
from pyod.models.mad import MAD mad = MAD().fit(google[['Volume']])is_outlier = mad.labels_ == 1 print(len(google[is_outlier]))
236
IForest pe serii de timp
google['day_of_week'] = google.index.day_of_week
google['month'] = google.index.month
google['day_of_month'] = google.index.day

google.head()
              Open    High     Low   Close    Volume  day_of_week  month  \
Date
2006-01-03  211.47  218.05  209.32  217.83  13137450            1      1
2006-01-04  222.17  224.70  220.09  222.84  15292353            2      1
2006-01-05  223.22  226.00  220.97  225.85  10815661            3      1
2006-01-06  228.66  235.49  226.85  233.06  17759521            4      1
2006-01-09  233.44  236.94  230.70  233.68  12795837            0      1
IForest pe serii de timp
from pyod.models.iforest import IForest iforest = IForest().fit(google)# Generate probabilities probs = iforest.predict_proba(google) # Isolate the outliers is_outlier = probs[:, 1] > 0.75 outliers = google[is_outlier] print(len(outliers))
60
Să exersăm!
Detecția anomaliilor în Python

