MA-uri indicatori de trend

Tranzacționare financiară în Python

Chelsea Yang

Data Science Instructor

Ce sunt indicatorii tehnici?

  • Calcule matematice bazate pe date istorice de piață
  • Presupun că piața este eficientă și prețul reflectă toate informațiile publice
  • Ajută traderii să înțeleagă tiparele istorice de preț
Tranzacționare financiară în Python

Tipuri de indicatori

  • Indicatori de trend: măsoară direcția sau intensitatea unui trend
    • Exemplu: medii mobile (MA), Average Directional Movement Index (ADX)
  • Indicatori de impuls: măsoară viteza mișcării prețului
    • Exemplu: Relative Strength Index (RSI)
  • Indicatori de volatilitate: măsoară amplitudinea deviațiilor de preț
    • Exemplu: Bollinger Bands
Tranzacționare financiară în Python

Pachetul TA-Lib

TA-Lib: Technical Analysis Library

  • Include peste 150 de implementări de indicatori tehnici
import talib
Tranzacționare financiară în Python

Indicatori de medie mobilă

  • SMA: Media mobilă simplă
  • EMA: Media mobilă exponențială


  • Caracteristici:
    • Urmăresc prețul
    • Netezesc datele pentru a indica mai bine direcția prețului
Tranzacționare financiară în Python

Media mobilă simplă (SMA)

$ SMA = (P_1+P_2+...+P_n)/n $

# Calculate two SMAs
stock_data['SMA_short'] = talib.SMA(stock_data['Close'], timeperiod=10)
stock_data['SMA_long'] = talib.SMA(stock_data['Close'], timeperiod=50)

# Print the last five rows print(stock_data.tail())
             Close  SMA_short  SMA_long
Date                                   
2020-11-24 1768.88    1758.77   1594.74
2020-11-25 1771.43    1760.65   1599.75
2020-11-27 1793.19    1764.98   1605.70
2020-11-30 1760.74    1763.35   1611.71
2020-12-01 1798.10    1765.02   1619.05

Tranzacționare financiară în Python

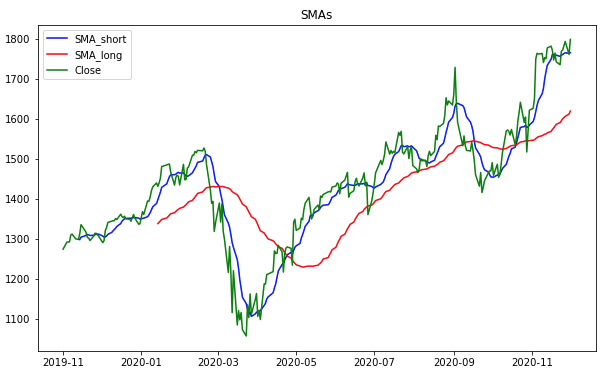
Reprezentarea grafică a SMA

import matplotlib.pyplot as plt

# Plot SMA with the price
plt.plot(stock_data['SMA_short'], 
         label='SMA_short')
plt.plot(stock_data['SMA_long'], 
         label='SMA_long')
plt.plot(stock_data['Close'], 
         label='Close')

# Customize and show the plot
plt.legend()
plt.title('SMAs')
plt.show()

Grafic SMA

Tranzacționare financiară în Python

Media mobilă exponențială (EMA)

$EMA_n = P_n \times multiplier + \text{previous EMA} \times (1-multiplier)$

$multiplier = 2 / (n + 1)$

# Calculate two EMAs
stock_data['EMA_short'] = talib.EMA(stock_data['Close'], timeperiod=10)
stock_data['EMA_long'] = talib.EMA(stock_data['Close'], timeperiod=50)
# Print the last five rows
print(stock_data.tail())
             Close  EMA_short  EMA_long
Date                                   
2020-11-24 1768.88    1748.65   1640.98
2020-11-25 1771.43    1752.79   1646.09
2020-11-27 1793.19    1760.13   1651.86
2020-11-30 1760.74    1760.24   1656.13
2020-12-01 1798.10    1767.13   1661.70
Tranzacționare financiară în Python

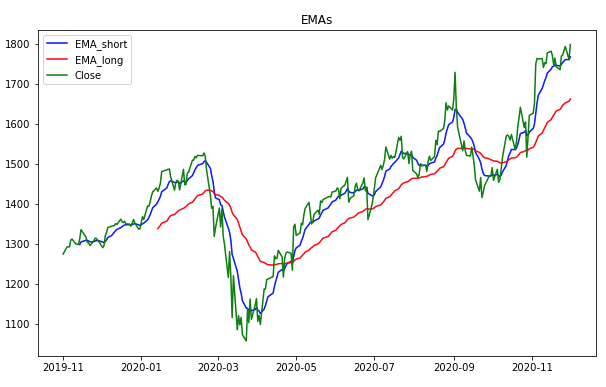
Reprezentarea grafică a EMA

import matplotlib.pyplot as plt
# Plot EMA with the price
plt.plot(stock_data['EMA_short'], 
         label='EMA_short')
plt.plot(stock_data['EMA_long'], 
         label='EMA_long')
plt.plot(stock_data['Close'], 
         label='Close')

# Customize and show the plot
plt.legend()
plt.title('EMAs')
plt.show()

Grafic EMA

Tranzacționare financiară în Python

SMA vs. EMA

EMA este mai sensibilă la mișcările recente ale prețului
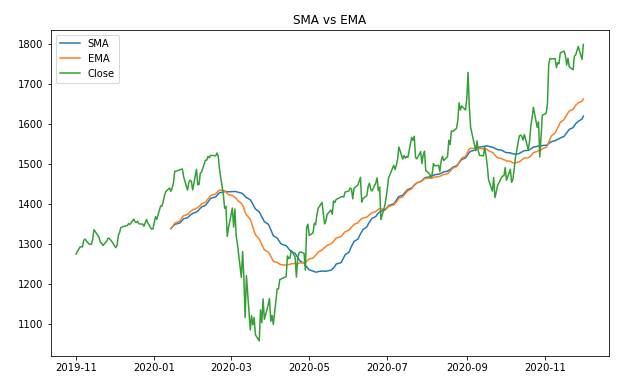
Grafic comparativ SMA vs. EMA calculat cu aceeași fereastră de timp

Tranzacționare financiară în Python

Să exersăm!

Tranzacționare financiară în Python

Preparing Video For Download...