Vizualizarea aspectelor datelor cu fațete

Comunicarea cu date în Tidyverse

Timo Grossenbacher

Data Journalist

Funcția facet_grid()
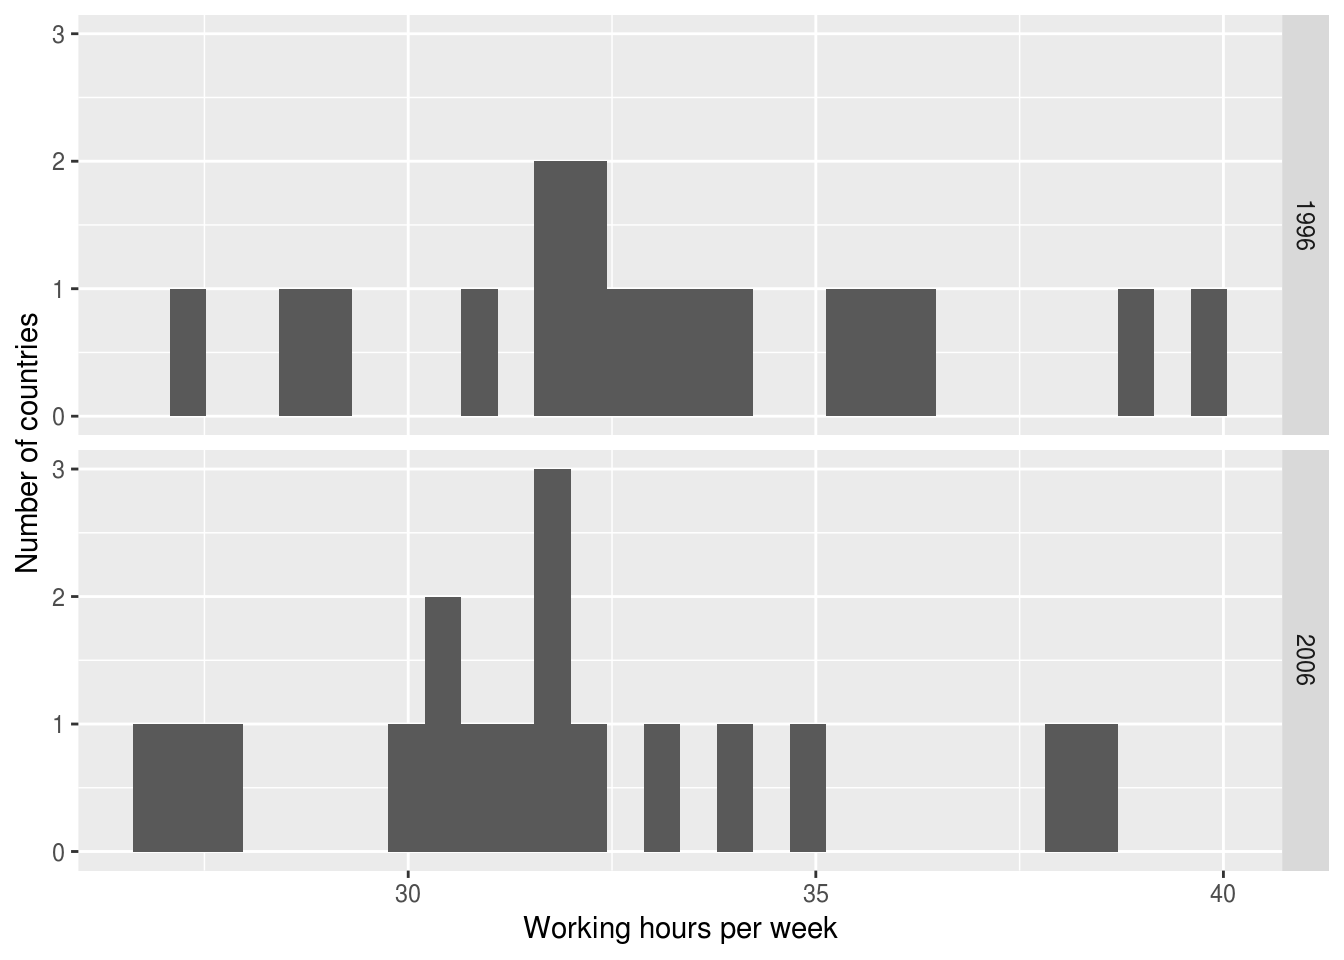
ilo_data <- ilo_data %>%
  filter(year == "1996" | year == "2006") 
ilo_plot <- ggplot(ilo_data) +
  geom_histogram(aes(
    x = working_hours)) +
  labs(x = "Working hours per week",
       y = "Number of countries")

ilo_plot +
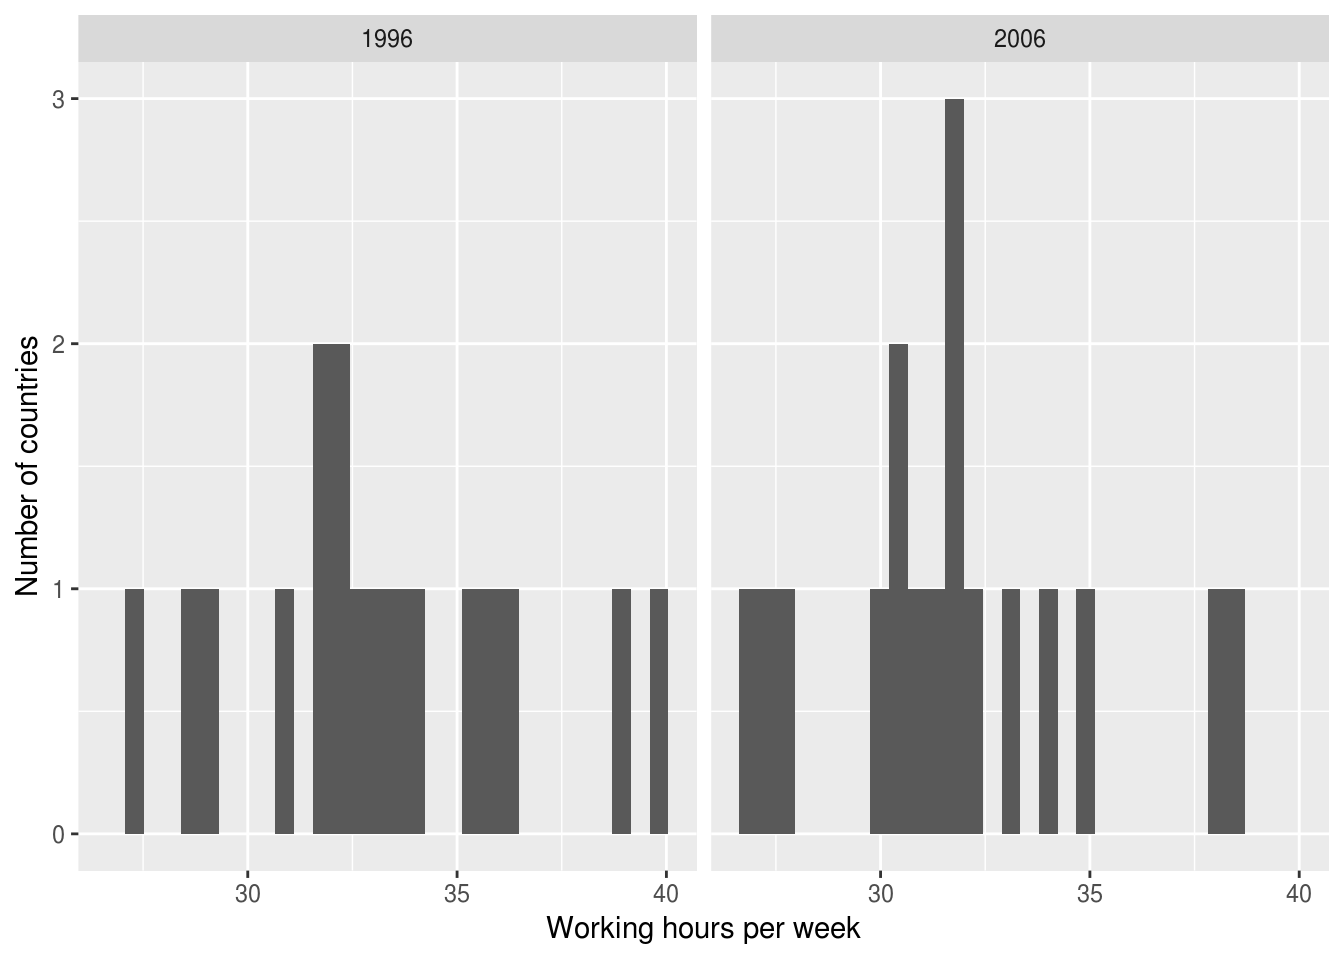
  facet_grid(cols = vars(year))
ilo_plot +
  facet_grid(rows = vars(year))

Comunicarea cu date în Tidyverse

Funcția facet_grid()

ilo_data <- ilo_data %>%
  filter(year == "1996" | year == "2006")
ggplot(ilo_data) +
  geom_histogram(aes(x = working_hours)) +
  labs(x = "Working hours per week",
       y = "Number of countries") +
  facet_grid(cols = vars(year))

ggplot(ilo_data) +
  geom_histogram(aes(x = working_hours)) +
  labs(x = "Working hours per week",
       y = "Number of countries") +
  facet_wrap(facets = vars(year))

Comunicarea cu date în Tidyverse

Grafic de dispersie cu fațete

Comunicarea cu date în Tidyverse

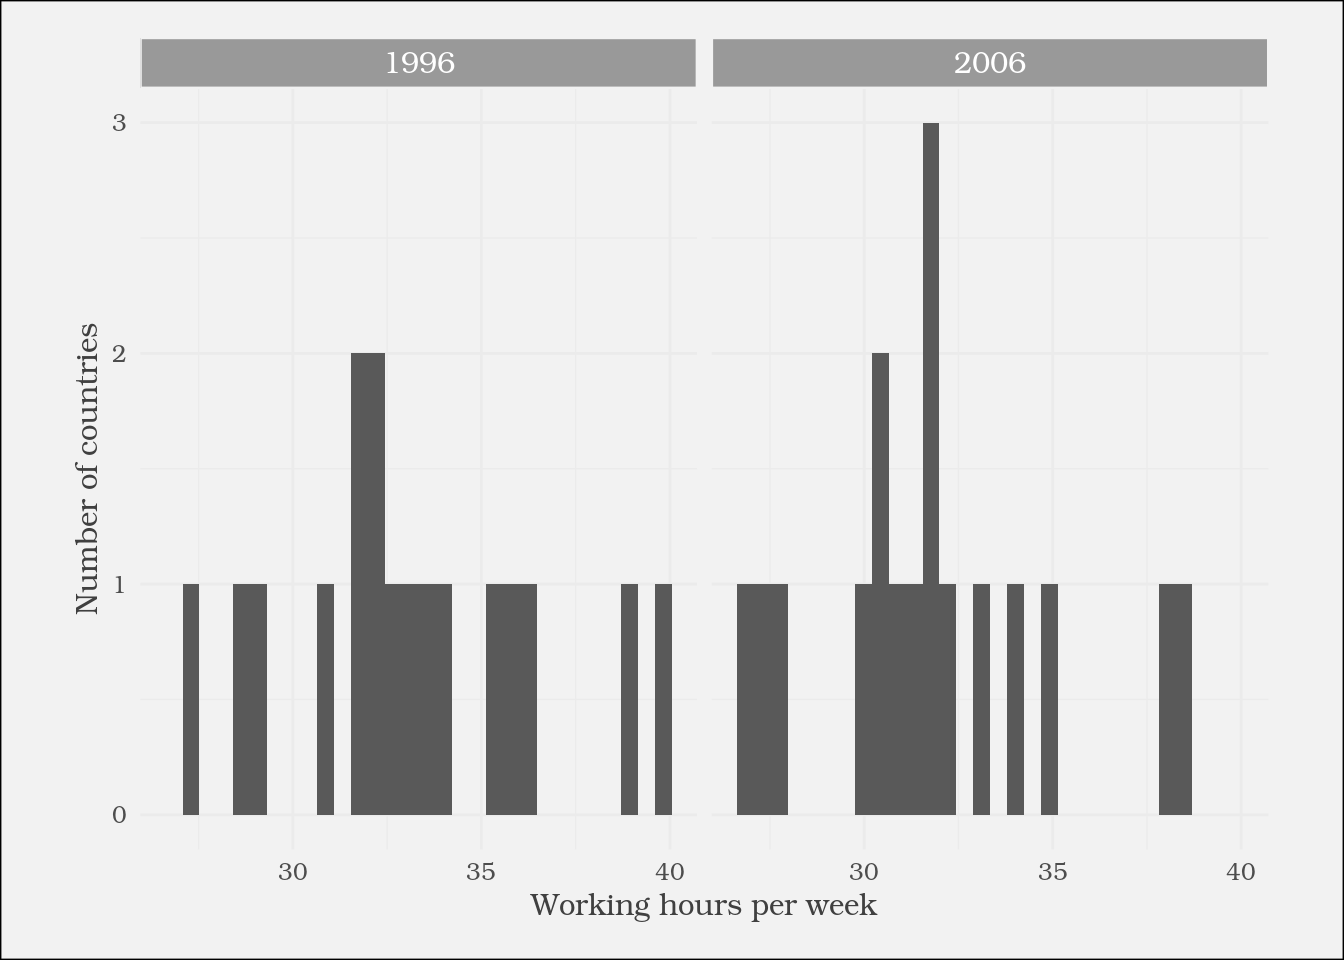
Stilizarea graficelor cu fațete

strip.background
strip.text
...
Comunicarea cu date în Tidyverse

Definirea unei funcții de temă personalizate
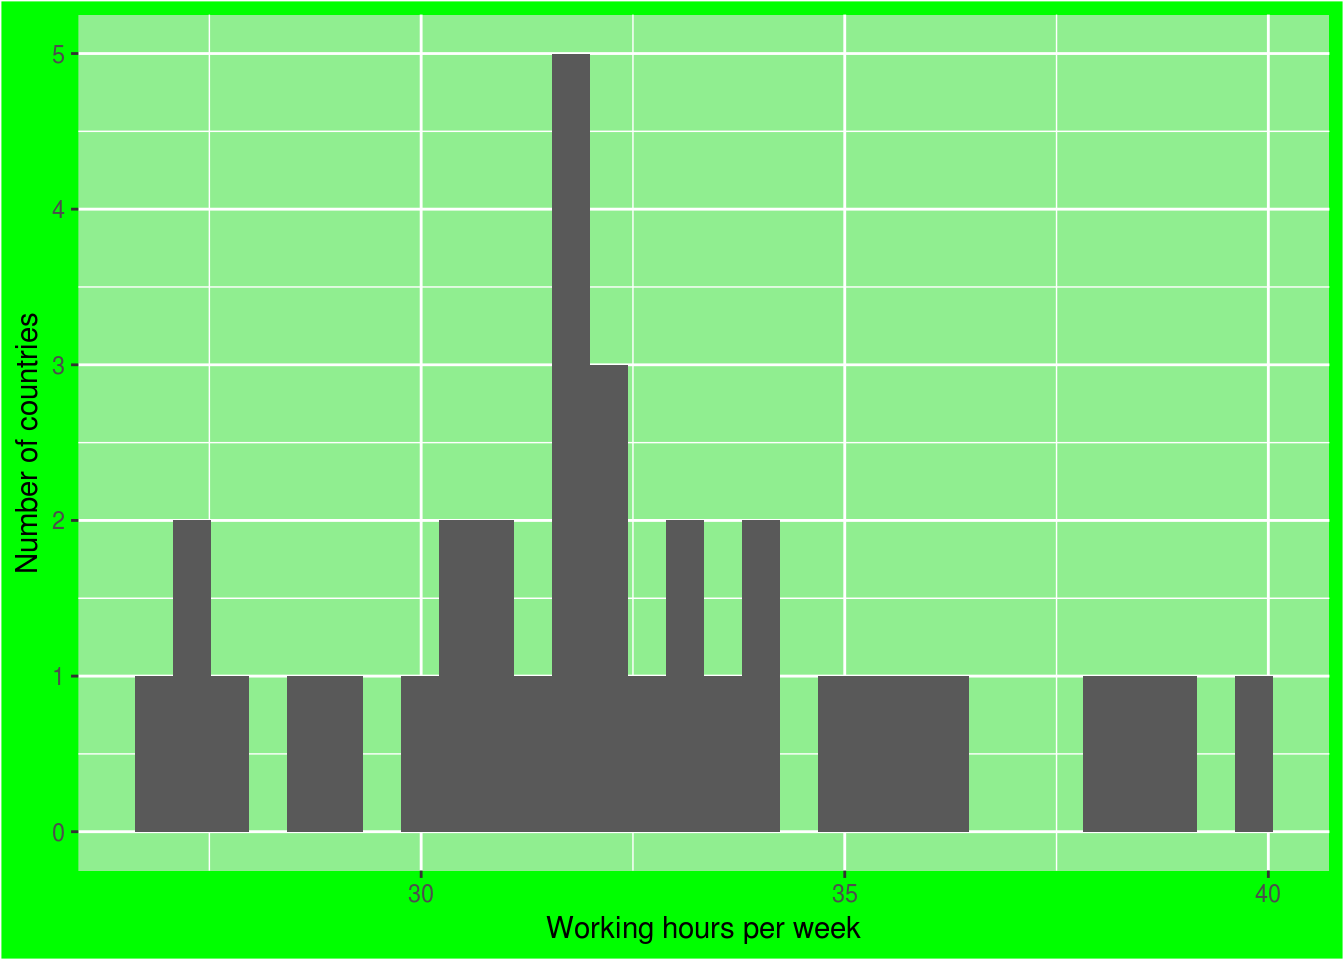
theme_green <- function(){
  theme(
    plot.background = 
      element_rect(fill = "green"),
    panel.background = 
      element_rect(fill = 
        "lightgreen")
  )}
ggplot(ilo_data) +
  geom_histogram(aes(
    x = working_hours)) +
  labs(x = "Working hours per week",
       y = "Number of countries") +

theme_green()

Comunicarea cu date în Tidyverse

Să exersăm!

Comunicarea cu date în Tidyverse

Preparing Video For Download...