Modelare cu tidymodels în R
David Svancer
Data Scientist
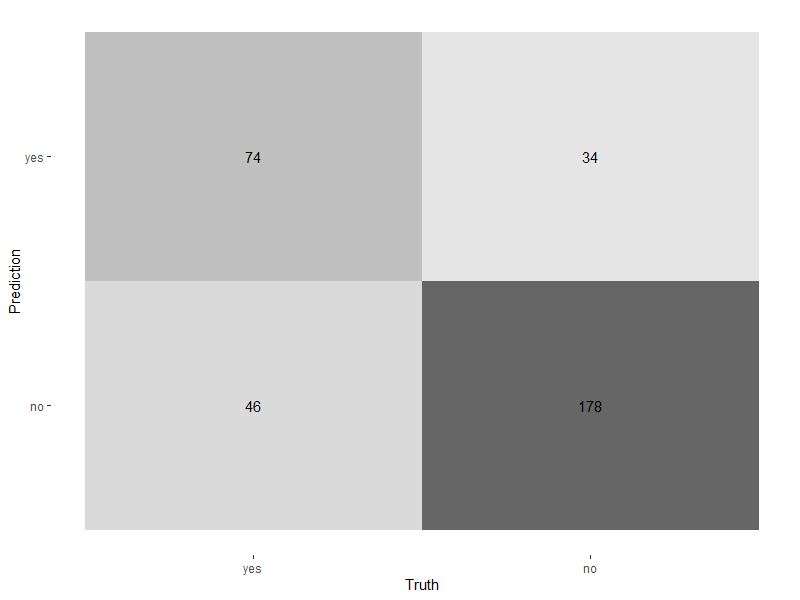
Heatmap cu autoplot()
autoplot()type la 'heatmap'
conf_mat(leads_results, truth = purchased, estimate = .pred_class) %>%autoplot(type = 'heatmap')

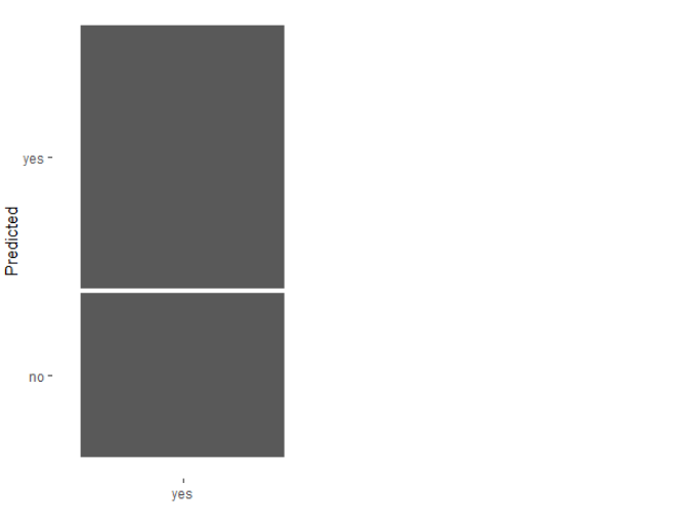
Mozaic cu autoplot()
type la 'mosaic'
conf_mat(leads_results,
truth = purchased,
estimate = .pred_class) %>%
autoplot(type = 'mosaic')

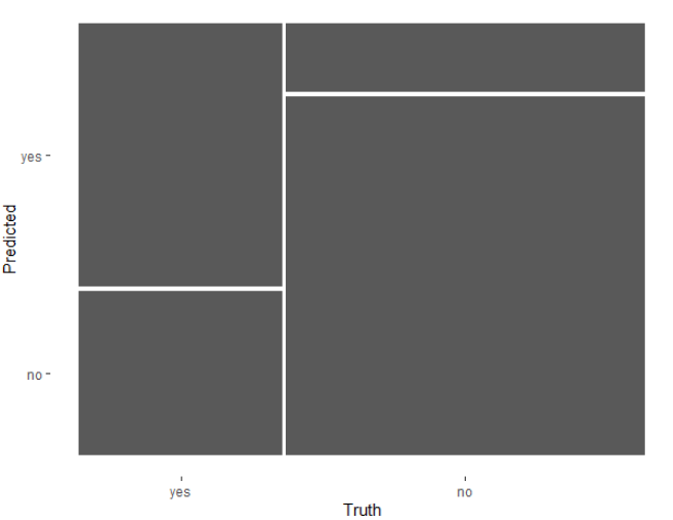
Mozaic cu autoplot()
type la 'mosaic'conf_mat(leads_results,
truth = purchased,
estimate = .pred_class) %>%
autoplot(type = 'mosaic')

Pragul de probabilitate implicit în clasificarea binară este 0,5
leads_results
.pred_yes este ≥ 0,5, atunci .pred_class este setat la 'yes' de funcția predict() din tidymodelsleads_results
# A tibble: 332 x 4
purchased .pred_class .pred_yes .pred_no
<fct> <fct> <dbl> <dbl>
1 no no 0.134 0.866
2 yes yes 0.729 0.271
3 no no 0.133 0.867
4 no no 0.0916 0.908
5 yes yes 0.598 0.402
6 no no 0.128 0.872
7 yes no 0.112 0.888
8 no no 0.169 0.831
9 no no 0.158 0.842
10 yes yes 0.520 0.480
# ... with 322 more rows
Cum performează un model de clasificare pe o gamă de praguri?
.pred_yes a rezultatelor din setul de test
| prag | specificitate | sensibilitate |
|---|---|---|
| 0 | 0 | 1 |
| 0.11 | 0.01 | 0.98 |
| 0.15 | 0.05 | 0.97 |
| ... | ... | ... |
| 0.84 | 0.89 | 0.08 |
| 0.87 | 0.94 | 0.02 |
| 0.91 | 0.99 | 0 |
| 1 | 1 | 0 |
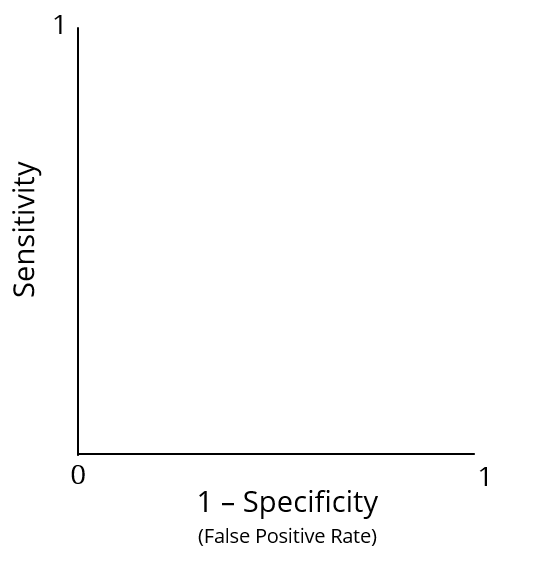
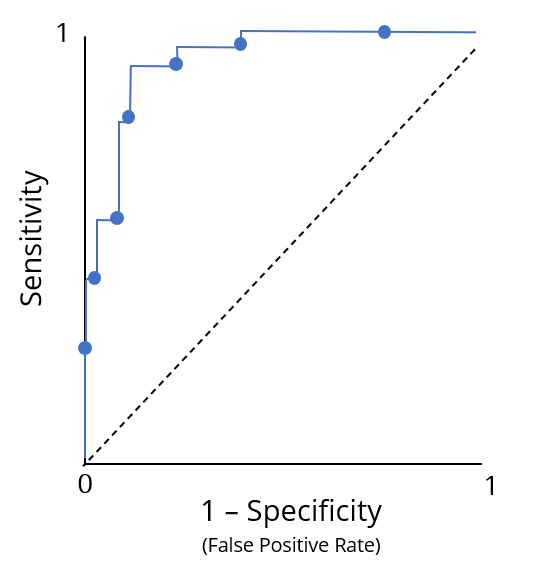
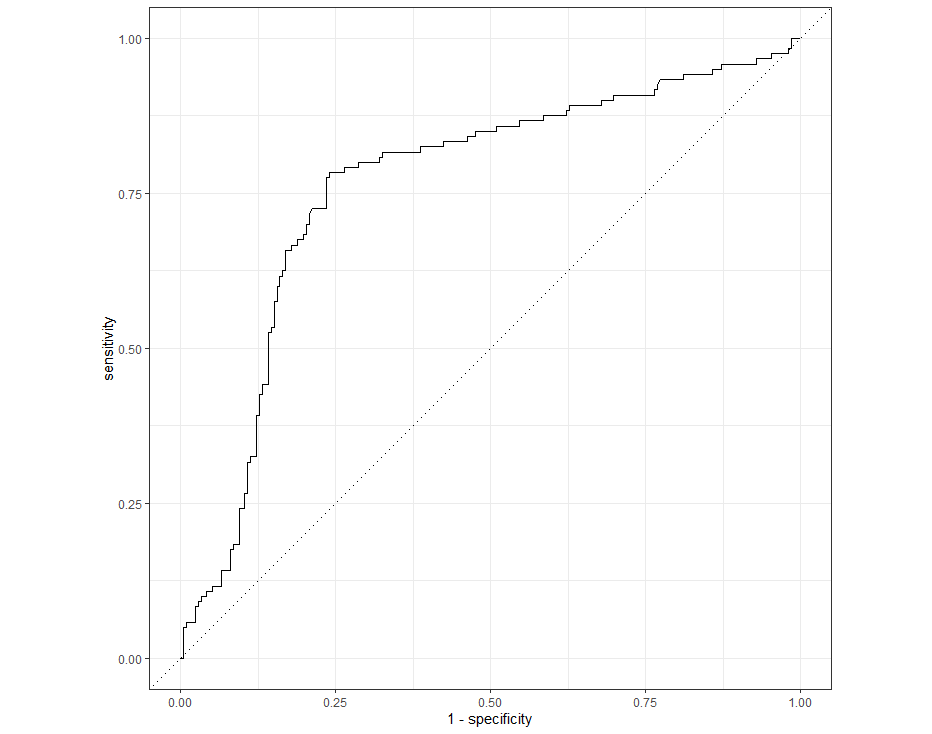
Curba caracteristicii operatorului receptor (ROC)

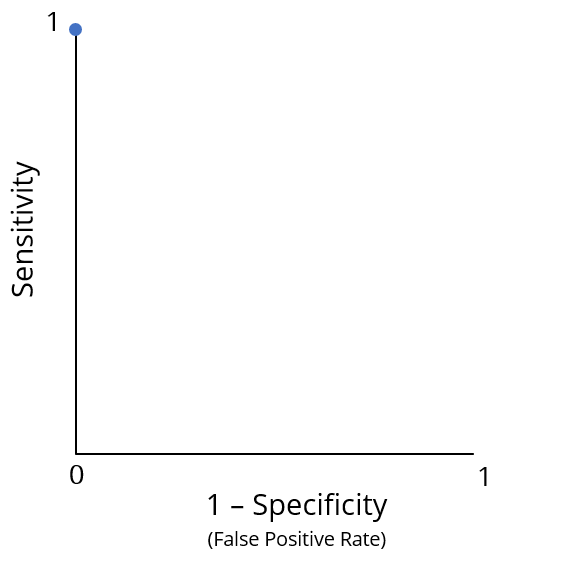
Performanța optimă se află în punctul (0, 1)
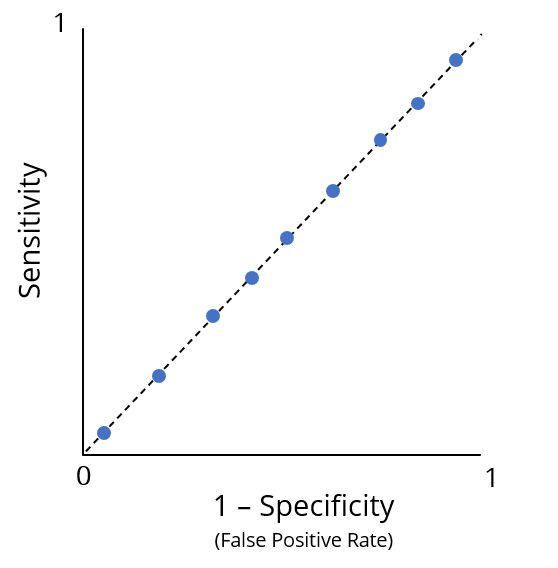
Performanță slabă

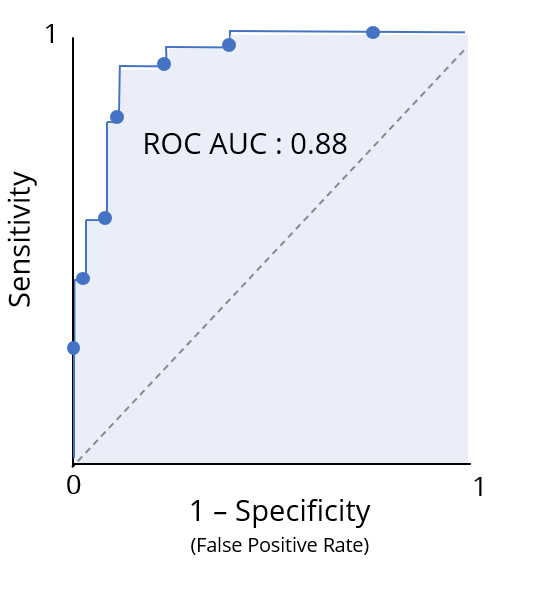
Aria de sub curba ROC (ROC AUC) rezumă informațiile curbei ROC ale unui model de clasificare într-un singur număr
Interpretare utilă ca notă de clasificare a performanței

Funcția roc_curve()
truth cu categoriile reale ale rezultatelor.pred_yes în tibble-ul leads_results
.pred_yesleads_results %>%
roc_curve(truth = purchased, .pred_yes)
# A tibble: 331 x 3
.threshold specificity sensitivity
<dbl> <dbl> <dbl>
1 -Inf 0 1
2 0.0871 0 1
3 0.0888 0.00472 1
4 0.0893 0.00943 1
5 0.0896 0.0142 1
6 0.0902 0.0142 0.992
7 0.0916 0.0142 0.983
8 0.0944 0.0189 0.983
# ... with 323 more rows
Transmiterea rezultatelor funcției roc_curve() către autoplot() returnează un grafic al curbei ROC
leads_results %>%
roc_curve(truth = purchased, .pred_yes) %>%
autoplot()

Funcția roc_auc() din yardstick calculează ROC AUC
truthroc_auc(leads_results,
truth = purchased,
.pred_yes)
# A tibble: 1 x 3
.metric .estimator .estimate
<chr> <chr> <dbl>
1 roc_auc binary 0.763
Modelare cu tidymodels în R